Taiwan Semiconductor (TSM) Stock Latest: Climbs 4.25% on Wednesday, Up 4.4% in Five Sessions
Technical analysis of TSM stock on November 11, 2026: price 413.35 USD, trend sideways, RSI 49.5, support 353.10, resistance 439.51.
TSMC's New York-listed shares jumped 4.25% to $413.35 in the Wednesday, November 11, 2026 session, up from a prior close of $396.48. The move lifts the five-day gain to 4.45%, yet the stock is still down 3.87% over one month. The rebound is real, but it has not yet changed the larger picture: the price is back above its short-term average and still below its longer-term one.
Why TSM is in focus today
- One-day move of 0.00%, about 0.0× its average daily range (ATR)
Selected automatically from 7 NYSE (US) stocks by a technical-signal score with daily weighted randomisation — not a recommendation.
Trend and Price Action
The stock closed above its 20-day simple moving average (SMA20) of $410.39 but below the 50-day average of $430.68. That is the signature of a bounce inside a broader pause. The 20-day average itself fell 3.57% over five days, so the short-term trend line is still pointing down even as the price climbs back over it. Chart readers call this a recovery that has to prove itself: the average the price just reclaimed is still sloping the wrong way.
No moving-average cross has formed recently, so there is no fresh golden-cross or death-cross signal to lean on. The trend reads as sideways. Within the 20-day range, the price sits at 70% of the distance between support at $353.10 and resistance at $439.51. The three-month high of $487.47 and low of $351.19 frame the wider swing and show how much ground the stock has given back from its peak.
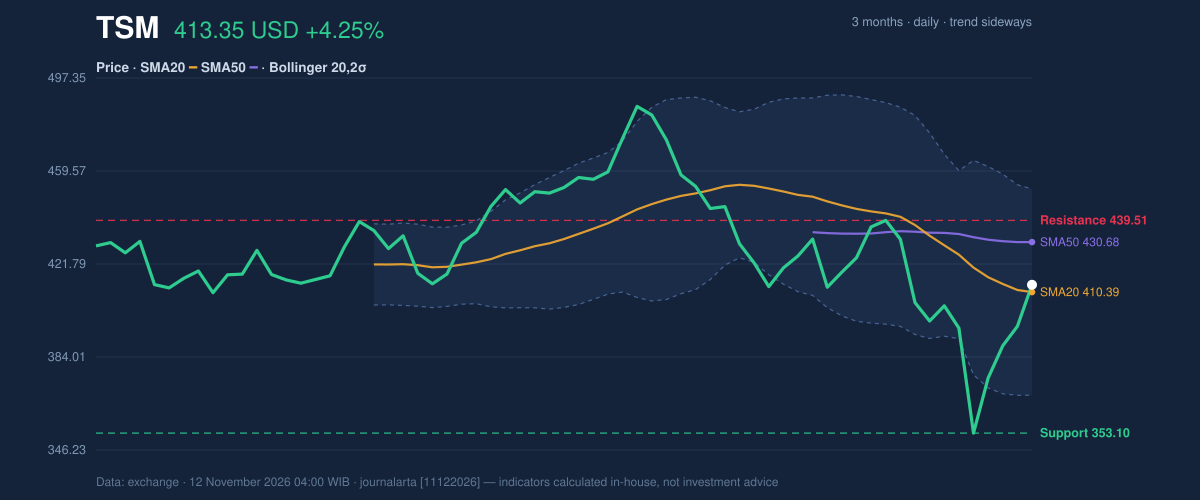
As the chart shows, the price is sitting between the middle and upper Bollinger bands. The middle band coincides with the SMA20 at $410.39, the upper band is at $452.28 and the lower at $368.50. The %B reading of 54% means the close is only slightly above the midpoint of the band range, which is not an extended position.
Oscillators and Momentum
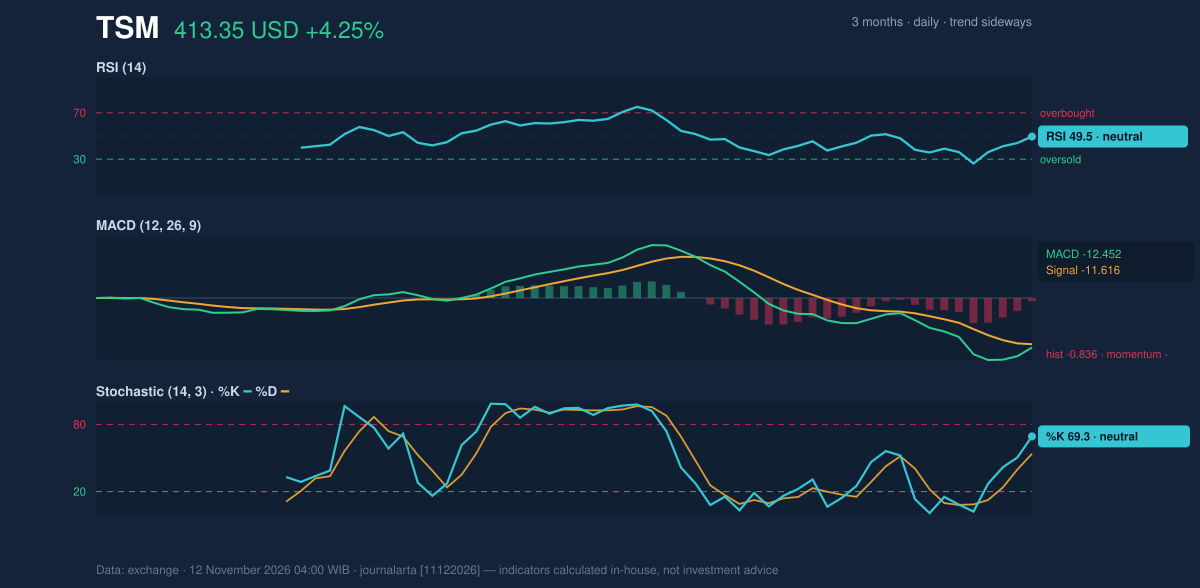
Momentum indicators are split, which is why the signal is muddy. The 14-day RSI, which measures the speed of recent gains against losses, stands at 49.5, a neutral reading almost exactly at the midpoint. After a 4.25% daily gain, many would expect RSI to be higher; that it is not suggests the preceding weeks of weakness are still weighing on the calculation.
The Stochastic oscillator, which shows where the close sits within its recent range, is more upbeat: %K at 69.3 against %D at 53.8. %K above %D points to short-term upward momentum, but both remain in neutral territory, so it is a tentative lift rather than an overbought warning.
MACD, a trend-following gauge built from two moving averages, is less encouraging. It reads -12.452 against a signal line of -11.616, a histogram of -0.836. Negative values mean the faster average is still below the slower one. The histogram is small, however, which says the downward pressure is modest and could flip if the price keeps climbing.
Volatility and Volume
The Bollinger bands are widening, with a band width of 20.4%, a sign that price swings are expanding rather than compressing. The 14-day average true range (ATR) is $18.00, or 4.4% of the price. In plain terms, the stock has been moving by roughly that much on a typical day, so a 4.25% advance is close to an ordinary swing for TSMC at present, not an outlier. Applying 1.5 times ATR gives a band of $386.35 to $440.35, which brackets the current price.
Volume offers the least confirmation. Wednesday's turnover was 14,398,200 shares, 0.9 times the 20-day average of 15,315,290. A rally on slightly below-normal participation is less convincing than one on heavy volume. On-balance volume (OBV), which adds volume on up days and subtracts it on down days, is falling even as the price rose. That divergence suggests the recent selling pressure has not been fully reversed by buyers.
Key Levels and Scenarios
The nearest ceiling is the 20-day resistance at $439.51. The upper end of the ATR band, $440.35, sits just above it, so the two levels reinforce each other as a zone. A close above it would put the 50-day average at $430.68 behind the price and open the way toward the upper Bollinger band at $452.28. On the downside, the price needs to hold above the SMA20 at $410.39; failing that, the lower ATR marker of $386.35 and the lower Bollinger band at $368.50 come into view, with support at $353.10 beneath them.
Technical Verdict: HOLD (wait & see)
JournalArta's research model scores TSM at -40 on a scale of -100 to +100, short of the -60 threshold for a negative call and well below the +60 needed for a positive one. The result is HOLD (wait & see), because trend and momentum are not aligned yet. The main reasons:
- The price is below the 50-day average, and the 20-day average is below the 50-day.
- MACD remains negative at -12.452, and OBV is falling despite the price rise.
- RSI at 49.5 and Stochastic %K at 69.3 are neutral, offering no decisive confirmation either way.
The levels below are conditional scenarios drawn from the reference data, not recommendations:
- Upside scenario: entry range only after a close above $439.51; target $452.28, then $487.47; stop-loss protection at $410.39.
- Downside scenario: triggered if price breaks $353.10; reference target $351.19; the stop level for the scenario would be $368.50.
The hold verdict is invalidated if the price closes above $439.51 or breaks below $353.10. In plain terms, the chart is not giving a clear direction, and the stock needs to clear $439.51 or lose $353.10 before the signals line up.
Summary Data TSM
| Last price | 413.35 USD |
| Change 1 day / 5 days / 1 month | 4.25% / 4.45% / -3.87% |
| Trend / MA-cross | sideways / none |
| SMA20 / SMA50 | 410.39 / 430.68 |
| RSI (14) / Stochastic %K | 49.5 / 69.3 |
| Bollinger %B / ATR | 54% / 18.00 |
| Support / Resistance 20 days | 353.10 / 439.51 |
| Data as of | 12 November 2026 04:00 WIB |
| JournalArta research verdict (score) | Hold (-40) |
Today's full Buy and Sell list for US stocks →
Disclaimer: This technical analysis is generated automatically from exchange data and indicators calculated by JournalArta, for information and education only. The verdict and the entry, target and stop-loss levels are not investment advice or a solicitation to buy or sell any security. Investment decisions and their risks rest solely with the reader.
Track TSM stock price daily: live levels, support/resistance and our full TSM analysis history.