Palantir (PLTR) Stock Climbs 2.12% (November 11, 2026): Down 14.2% in a Month
Technical analysis of PLTR stock on November 11, 2026: price 172.40 USD, trend downtrend, RSI 42.3, support 154.99, resistance 201.72.

Palantir's shares rose 2.12% to $172.40 in the Nasdaq session of Wednesday, November 11, 2026. The bounce came as the stock logged a fresh death cross, the 20-day average slipping beneath the 50-day, and while it remains down 14.22% over one month. For global investors, the question is whether this is a pause in a sell-off or just a rally inside a downtrend.
Why PLTR is in focus today
- One-day move of 0.00%, about 0.0× its average daily range (ATR)
Selected automatically from 11 NASDAQ (US) stocks by a technical-signal score with daily weighted randomisation — not a recommendation.
Trend & Price Action
The structure is bearish. The stock trades below its 20-day average of 184.70, which now sits just under the 50-day at 185.04. That death cross formed on the latest session. It is a signal where the shorter-term average crosses beneath the longer one, and traders read it as a sign that recent prices are weaker than the medium-term trend. The 20-day average fell 5.15% over five days, which describes the slope of the average itself rather than the share price. The stock is up 0.41% over the same five days, so the bounce has barely dented the slide.
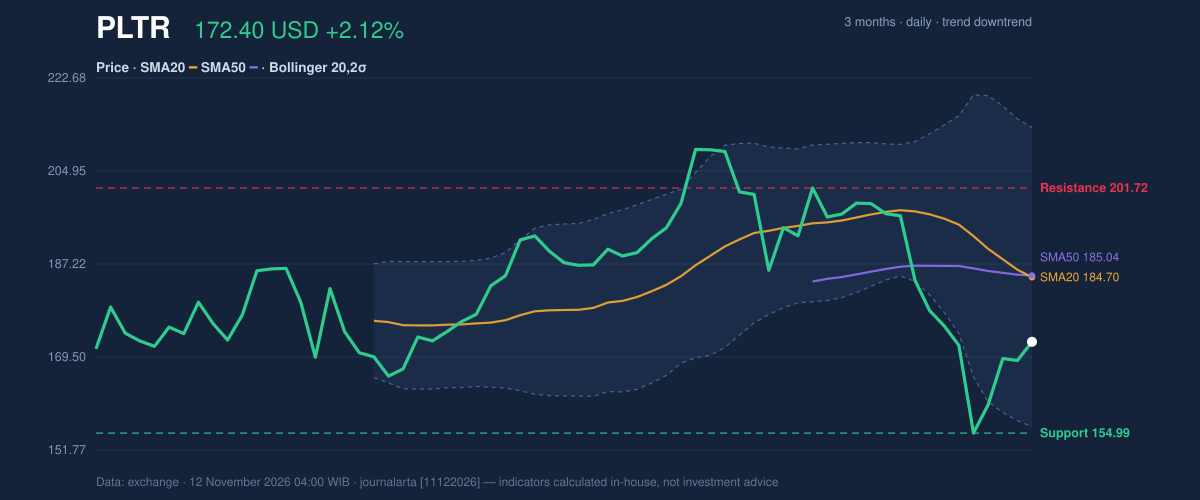
As shown in the chart, the price sits at about 37% of its 20-day range, between support at 154.99 and resistance at 201.72. The three-month high of 212.94 is well out of reach, while the three-month low of 152.60 sits only a little below support. A rally that stalls under the two averages around 185 would fit the pattern of a downtrend that is merely catching its breath.
Oscillators & Momentum
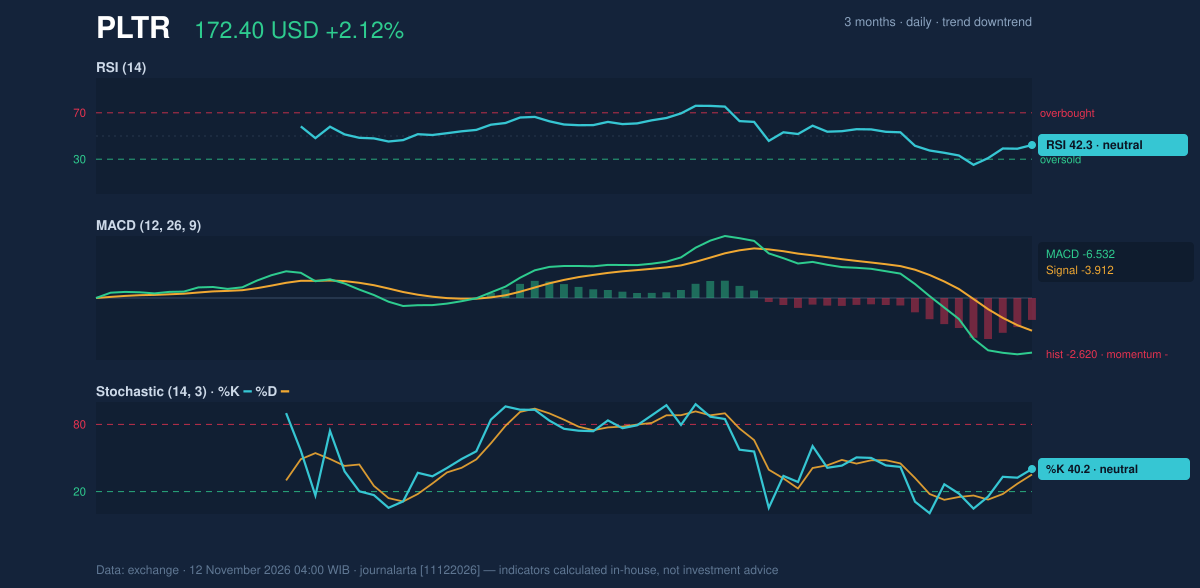
Momentum gauges describe a weak stock rather than an exhausted one. The RSI(14) is 42.3, in neutral territory. The Stochastic reads 40.2 (%K) and 35.3 (%D), also neutral, with the faster line above the slower one, a mild sign that selling pressure has eased in the short run. Neither indicator shows the washed-out conditions that usually precede a durable reversal.
The MACD is -6.532 against a signal line of -3.912, leaving a histogram of -2.620. MACD tracks the gap between short- and long-term averages, and a negative reading that sits further below its signal line means downside momentum is still building, not fading. That fits the death cross: the oscillators have not yet confirmed the bounce.
Volatility & Volume
The Bollinger Bands, which sit two standard deviations either side of the 20-day average, are widening. Their width is 30.9%, a sign of high volatility, with the upper band at 213.22 and the lower at 156.19. The price sits at a %B of 28%, in the lower part of the channel but not at its floor. The ATR(14), a measure of average daily range, is 9.64, or 5.6% of the price. A stock moving that much each day can swing through its levels quickly in either direction.
Participation is the weak spot for the bounce. Volume on the latest session was 16,017,600 shares, only 0.6 times the 20-day average of 26,127,580. On-balance volume, which adds volume on up days and subtracts it on down days, is falling. A rise on thin volume with falling OBV suggests buyers are not committing in size, which is why the move looks more like a bounce than a turn.
Fundamental Context
The technical picture contrasts sharply with the company's latest results. According to its SEC filing (Form 10-Q, filed November 3), Palantir reported quarterly revenue of $2.31 billion for the quarter ended September 30, up 95.9% from $1.18 billion a year earlier. Net income was $1.13 billion, compared with $475.6 million a year earlier, and diluted earnings per share were $0.44. The company also filed a Form 8-K on November 2 covering its results of operations and a Regulation FD disclosure. Strong earnings have not stopped the share price from sliding over the past month, which suggests the market is weighing other factors, such as valuation and positioning, more heavily.
Technical Verdict: SELL
The JournalArta research model rates PLTR SELL, with a score of -66 on a scale from -100 to +100 (the sell threshold is -60). The strongest reasons:
- Death cross: the 20-day average has crossed below the 50-day, and the price sits below both.
- Weak confirmation: the MACD histogram is -2.620 and OBV is falling, while the latest bounce came on 0.6 times normal volume.
- Signal balance: one bullish signal (RSI rebounding from below 35) against three bearish ones, including the bounce into the 20-day average within a downtrend.
The levels, computed by code:
- Entry range (sell zone): 172.40 – 179.62
- Exit target 1: 147.82 (reward/risk 1.5)
- Exit target 2: 123.23 (reward/risk 3.0)
- Stop loss: 188.79
The verdict is invalidated if the price breaks above 188.79, which would put it back above both moving averages. A drop below support at 154.99 would bring the 152.60 three-month low into play.
In plain terms, the technical picture says the stock is still in a downtrend despite Wednesday's bounce and strong earnings, and this reading holds through December 10, 2026, unless the stop level is breached.
Summary Data PLTR
| Last price | 172.40 USD |
| Change 1 day / 5 days / 1 month | 2.12% / 0.41% / -14.22% |
| Trend / MA-cross | downtrend / death |
| SMA20 / SMA50 | 184.70 / 185.04 |
| RSI (14) / Stochastic %K | 42.3 / 40.2 |
| Bollinger %B / ATR | 28% / 9.64 |
| Support / Resistance 20 days | 154.99 / 201.72 |
| Data as of | 12 November 2026 04:00 WIB |
| JournalArta research verdict (score) | Sell (-66) |
| Sell zone | 172.40 – 179.62 |
| Target 1 / 2 | 147.82 / 123.23 |
| Stop loss | 188.79 |
| Reward/risk | 1.5 / 3.0 |
Today's full Buy and Sell list for US stocks →
Disclaimer: This technical analysis is generated automatically from exchange data and indicators calculated by JournalArta, for information and education only. The verdict and the entry, target and stop-loss levels are not investment advice or a solicitation to buy or sell any security. Investment decisions and their risks rest solely with the reader.
Track PLTR stock price daily: live levels, support/resistance and our full PLTR analysis history.