Oracle (ORCL) Stock Jumps 8.82% (November 11, 2026): Up 3.8% in Five Sessions
Technical analysis of ORCL stock on November 11, 2026: price 128.38 USD, trend sideways, RSI 49.2, support 115.16, resistance 144.54.
Why ORCL is in focus today
- One-day move of 0.00%, about 0.0× its average daily range (ATR)
Selected automatically from 7 NYSE (US) stocks by a technical-signal score with daily weighted randomisation — not a recommendation.
Trend & Price Action
The data lean toward a bounce. The trend reads as sideways, and the stock sits above its 20-day simple moving average (SMA20) of $127.11 but well below its 50-day average (SMA50) of $137.61. In plain terms, Oracle has recovered its short-term footing without reclaiming its medium-term one. The averages tell a similar story. The 20-day average has fallen 3.45% over five days, so the stock's recent average cost is still drifting lower even as the latest price pops above it. No new crossover between the two averages has formed. The price is also stuck in the middle of its range. It sits at about 45% of the distance between the 20-day support of $115.16 and the 20-day resistance of $144.54. The three-month high is $170.70 and the low is $109.21, so Oracle remains far below its recent peak.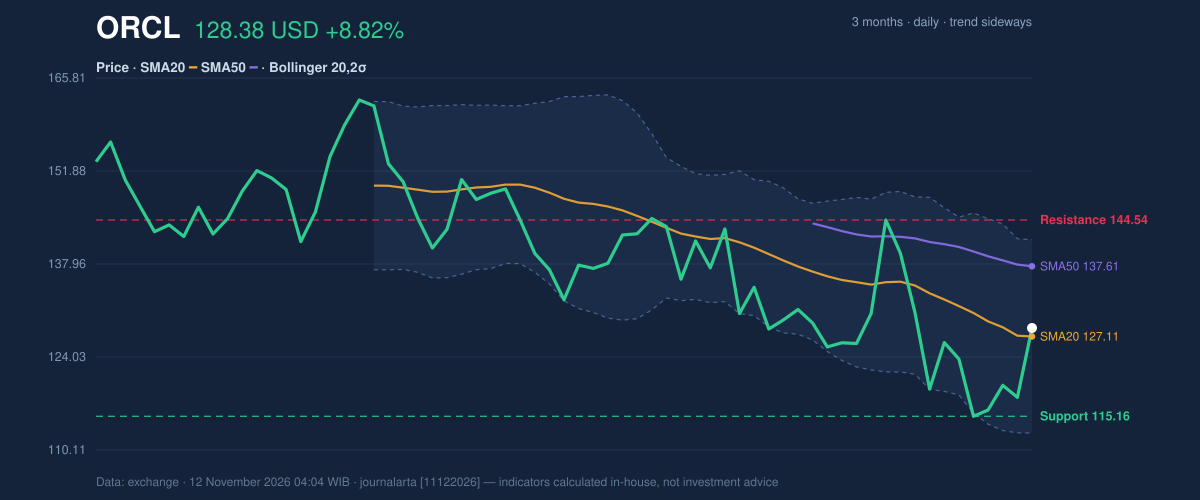
Oscillators & Momentum
Momentum indicators have not caught up with the price. The 14-day Relative Strength Index (RSI), which measures how fast gains and losses are accumulating, reads 49.2, firmly neutral. The Stochastic oscillator shows %K at 48.8 and %D at 32.7. The faster line sitting above the slower one hints at a short-term upturn, but neither is near an extreme. The MACD, which tracks the gap between short and long-term averages, is the weaker signal. It reads -4.668 against a signal line of -4.553, and the histogram is -0.114. Momentum is still negative, though the shortfall is small. One day of strength has not yet overturned weeks of softer momentum.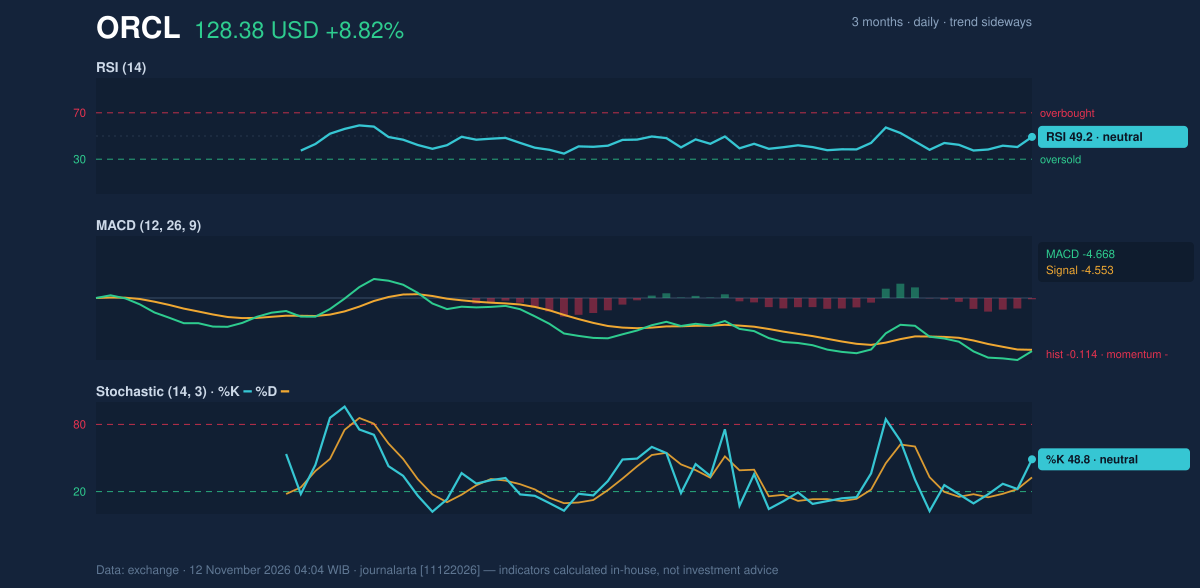
Volatility & Volume
Wednesday's rally came on lighter trading, not heavier. Volume was 38,489,200 shares, about 0.9 times the 20-day average of 43,025,690. A rally that attracts below-average participation is harder to trust, and the on-balance volume (OBV) line, which tallies buying and selling pressure, is still falling. The Average True Range (ATR) is 9.16, or 7.1% of the price, so Oracle routinely swings by a wide margin. That matters for risk: a move of several dollars in either direction would be ordinary for this stock.Key Levels & Scenarios
The reference levels define the map. Resistance sits at $144.54, with the three-month high at $170.70 above it. Support is at $115.16, with the three-month low at $109.21 below it. Volatility-adjusted bands put the range at $114.63 to $142.13. If Oracle closes above $144.54, it would clear the top of its 20-day range and put the SMA50 behind it. If it breaks below $115.16, the bounce would look like a pause within a downtrend. Between those two levels, the data do not favour either side.Fundamental Context
The company's financials are stronger than its chart. According to its SEC filing, Oracle reported quarterly revenue of $19.35 billion for the quarter ended August 31, 2026, up 29.6% from $14.93 billion a year earlier (Form 10-Q, filed September 11). Net income was $4.76 billion, compared with $2.93 billion a year earlier, and diluted earnings per share were $1.56. Oracle also filed a Form 8-K on November 4 reporting other material events. Strong earnings and a hesitant chart can coexist when expectations were already high.Technical Verdict: HOLD (wait & see)
JournalArta's research model scores Oracle at -48 on a scale of -100 to +100, short of the -60 threshold for a sell call and far from the +60 needed for a buy. The call is HOLD (wait & see), for these reasons: - Price is below the 50-day average, and the 20-day average is below the 50-day. - RSI at 49.2 and the MACD at -4.668 show momentum that has not confirmed the jump. - The only technical signal flagged is bearish: a bounce into the SMA20 within a downtrend. The verdict is invalidated if the price closes above $144.54 or breaks below $115.16. The conditional scenarios from the reference levels are: - Upside scenario: entry range above a close over $144.54; exit target $170.70 (three-month high); stop loss $137.61 (SMA50). - Downside scenario: entry range on a break below $115.16; exit target $109.21 (three-month low); stop loss $127.11 (SMA20). In plain terms: Oracle's big one-day gain has not yet changed its direction, so the technical evidence says to wait for a clear break above or below its recent range.Summary Data ORCL
| Last price | 128.38 USD |
| Change 1 day / 5 days / 1 month | 8.82% / 3.76% / -1.66% |
| Trend / MA-cross | sideways / none |
| SMA20 / SMA50 | 127.11 / 137.61 |
| RSI (14) / Stochastic %K | 49.2 / 48.8 |
| Bollinger %B / ATR | 54% / 9.16 |
| Support / Resistance 20 days | 115.16 / 144.54 |
| Data as of | 12 November 2026 04:04 WIB |
| JournalArta research verdict (score) | Hold (-48) |
Today's full Buy and Sell list for US stocks →
Disclaimer: This technical analysis is generated automatically from exchange data and indicators calculated by JournalArta, for information and education only. The verdict and the entry, target and stop-loss levels are not investment advice or a solicitation to buy or sell any security. Investment decisions and their risks rest solely with the reader.
Track ORCL stock price daily: live levels, support/resistance and our full ORCL analysis history.