Take-Two Interactive (TTWO) Stock on Wednesday: Climbs 2.97%, Up 14.9% in a Month
Technical analysis of TTWO stock on November 11, 2026: price 231.31 USD, trend sideways, RSI 67.9, support 190.17, resistance 231.31.

Take-Two Interactive (NASDAQ: TTWO) closed Wednesday, November 11, 2026, at $231.31, up 2.97% on the day from a previous close of $224.64. The stock has gained 10.73% over five days and 14.95% over one month. It reached the top of its 20-day range on volume of 5,311,700 shares, about 1.6 times the 20-day average of 3,250,205. Code-based screening flagged that combination, a close above the 20-day high on at least 1.5 times average volume, as the one bullish technical signal. No bearish signal fired.
Why TTWO is in focus today
- One-day move of 0.00%, about 0.0× its average daily range (ATR)
- Volume at 0.0× the 20-day average
Selected automatically from 11 NASDAQ (US) stocks by a technical-signal score with daily weighted randomisation — not a recommendation.
Trend and Price Action
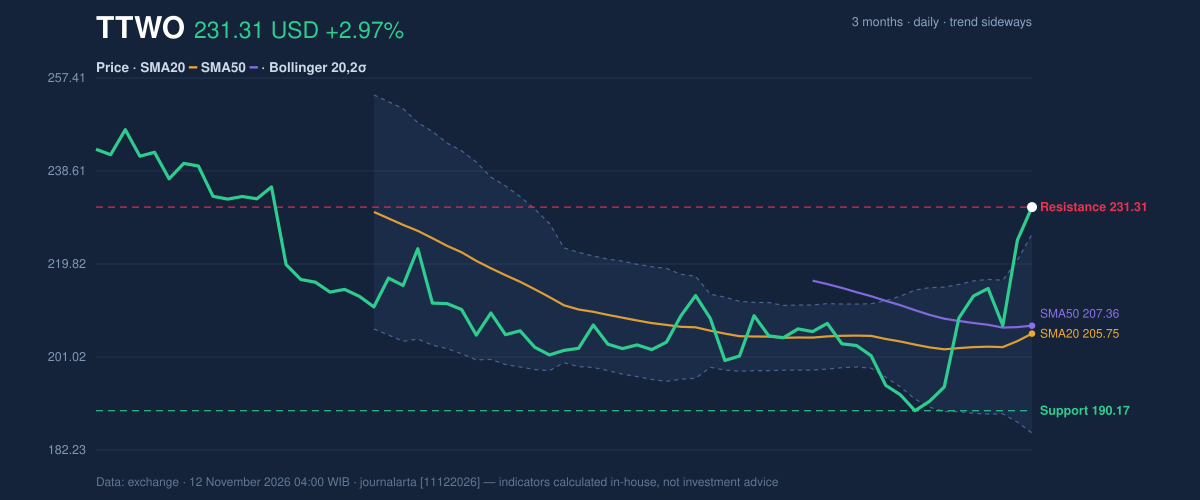
The price now sits above both the 20-day average ($205.75) and the 50-day average ($207.36). The trend reading is still "sideways." The 20-day average rose 1.44% over five days, but it remains below the 50-day average, and no new moving-average crossover has formed. In plain terms, the recent surge has outrun the slower averages. They have not yet confirmed that a durable uptrend is in place.
The close at $231.31 is also exactly the 20-day resistance, so the stock sits at 100% of its 20-day range. As shown in the chart below, the 3-month high of $248.98 is the next ceiling, while the 3-month low is $183.86.
Oscillators and Momentum
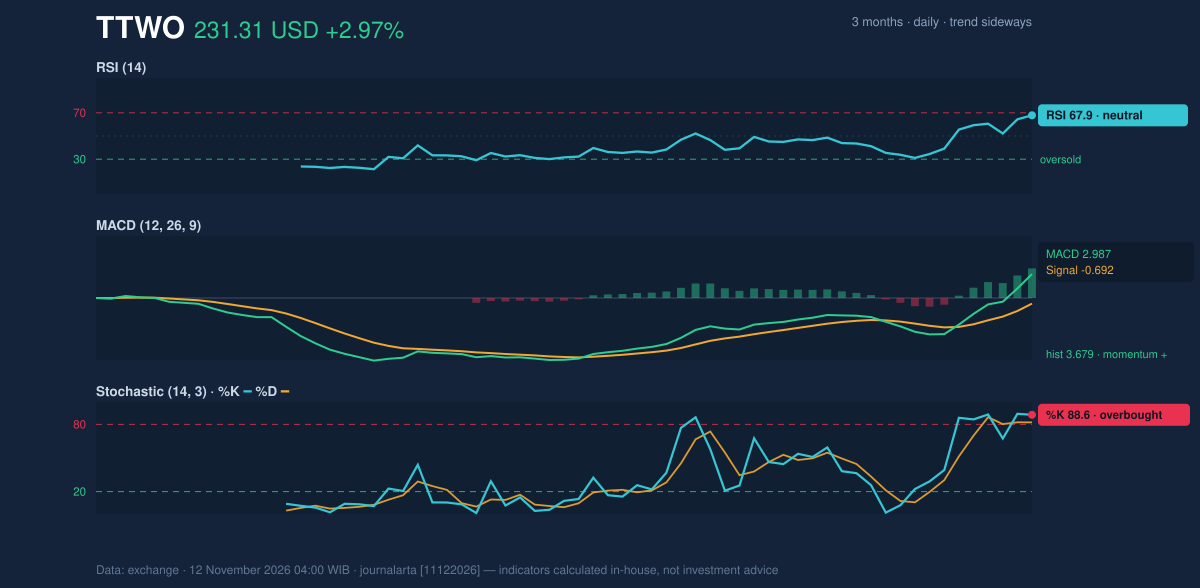
Momentum indicators point the same way but differ in how stretched they look. The 14-day RSI is 67.9, still classed as neutral but close to the conventional 70 line where buying is considered extended. The Stochastic oscillator is further along, with %K at 88.6 and %D at 81.8, both in overbought territory. The Stochastic compares the close with the recent high-low range, so a reading this high mostly confirms that the stock is closing at the top of its range.
The MACD, which measures the gap between short- and long-term price averages, reads 2.987 against a signal line of -0.692. The histogram of 3.679 shows positive momentum. A sharp swing from a negative signal line to a positive reading is typical of a rally that began recently, as this one did.
Volatility and Volume
The price is trading outside the upper Bollinger Band, which sits at $225.85. The %B reading of 114% means the close landed beyond that band. The band width of 19.5% is normal, so the move came without a prolonged squeeze beforehand. Closes outside the band show strength, but they often draw some mean reversion toward the middle band at $205.75.
The 14-day ATR, a measure of average daily trading range, is 9.29, or 4.0% of the price. That is high volatility, so daily swings of this size are ordinary for the stock now. Volume supports the move: the 1.6-times surge came on an up day, and on-balance volume, which tallies volume on up days against down days, is rising. Heavy participation behind a breakout makes it harder to dismiss as a thin-trading spike.
What the Filings Show
The rally follows a weak quarter on paper. According to its SEC filing (Form 10-Q, filed November 9), Take-Two reported quarterly revenue of $1.50 billion for the quarter ended September 30, down 15.6% from $1.77 billion a year earlier. It posted a net loss of $54.0 million, compared with a loss of $133.9 million a year earlier, and diluted earnings per share were -$0.29. The company also filed a Form 8-K on November 9 reporting its results of operations and financial condition. The filings alone do not explain the price move. The gap between falling revenue and rising shares suggests traders were focused on the narrower loss rather than on the revenue decline.
Key Levels and Scenarios
The 20-day resistance at $231.31 is the line the stock has just reached. A close above it would count as a confirmed breakout. The code-computed reference levels place the 1.5×ATR band at $217.38 below the price and $245.24 above it. On the downside, the 20-day support is $190.17, well below the current price, which leaves a wide gap between the price and its nearest support.
Technical Verdict: HOLD (wait & see)
The JournalArta research score is +33 on a scale running from -100 to +100. A Buy call needs +60 or higher, and a Sell call needs -60 or lower. The call is HOLD (wait & see) because trend and momentum are not yet aligned. The main reasons:
- Trend not confirmed: the 20-day average ($205.75) remains below the 50-day ($207.36), even with the price above both.
- Stretched momentum: Stochastic %K at 88.6 is overbought and RSI at 67.9 is near the 70 line.
- Participation is real: volume at 1.6 times average and rising OBV on an up day keep the bullish case alive.
The verdict would be invalidated if the price broke below the 20-day support of $190.17. These are conditional scenarios from the computed reference levels, not recommendations:
- Upside scenario, entry range: a close above $231.31, the 20-day resistance.
- Exit target: $245.24 (price + 1.5×ATR), with the 3-month high of $248.98 as the outer level.
- Stop loss: $217.38 (price − 1.5×ATR).
- Downside scenario: a break of the 20-day support at $190.17 would shift the view toward the 3-month low of $183.86.
For non-traders, the chart says the stock has run hard and fast, and it needs to hold above $231.31 before the rally looks trustworthy.
Summary Data TTWO
| Last price | 231.31 USD |
| Change 1 day / 5 days / 1 month | 2.97% / 10.73% / 14.95% |
| Trend / MA-cross | sideways / none |
| SMA20 / SMA50 | 205.75 / 207.36 |
| RSI (14) / Stochastic %K | 67.9 / 88.6 |
| Bollinger %B / ATR | 114% / 9.29 |
| Support / Resistance 20 days | 190.17 / 231.31 |
| Data as of | 12 November 2026 04:00 WIB |
| JournalArta research verdict (score) | Hold (+33) |
Today's full Buy and Sell list for US stocks →
Disclaimer: This technical analysis is generated automatically from exchange data and indicators calculated by JournalArta, for information and education only. The verdict and the entry, target and stop-loss levels are not investment advice or a solicitation to buy or sell any security. Investment decisions and their risks rest solely with the reader.
Track TTWO stock price daily: live levels, support/resistance and our full TTWO analysis history.