Caterpillar (CAT) Stock Climbs 2.91% (November 11, 2026): Down 19.7% in a Month
Technical analysis of CAT stock on November 11, 2026: price 601.61 USD, trend downtrend, RSI 35.2, support 553.64, resistance 740.21.

Why CAT is in focus today
- One-day move of 0.00%, about 0.0× its average daily range (ATR)
Selected automatically from 7 NYSE (US) stocks by a technical-signal score with daily weighted randomisation — not a recommendation.
Trend & Price Action
The price is below both moving averages. The 20-day simple moving average (SMA20) is at $658.19 and the 50-day (SMA50) at $748.51. A moving average is just the mean closing price over that many sessions, so a price under both means recent buyers are mostly sitting on losses. The 20-day average fell 7.19% over five days, a steep tilt that confirms the downtrend. No new crossover has formed. The 20-day line is already under the 50-day, a bearish arrangement traders call a death-cross setup, and nothing in the data suggests it has reversed. Bollinger Bands, which mark two standard deviations around the 20-day average, run from $532.32 to $784.06. They are 38.2% wide and still expanding. Expanding bands mean the stock is moving more, not settling. The price sits at 28% of the band's height (%B), in the lower third but not at the edge.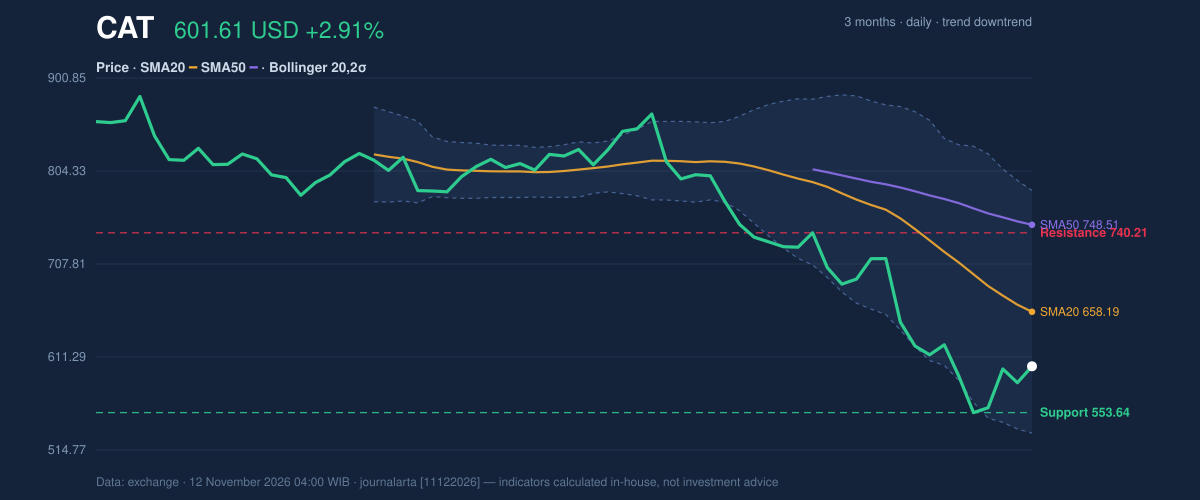
Oscillators & Momentum
Momentum gauges are weak but not washed out. The 14-day Relative Strength Index (RSI), which measures the speed of recent gains against losses, reads 35.2. That is neutral, close to the sub-30 zone usually called oversold. Stochastic %K is 27.9 against %D at 23.7, also neutral, with the faster line above the slower one. The MACD tells a harsher story. The line is at -52.504, below its signal line at -48.838, leaving a histogram of -3.666. The negative histogram shows downside momentum is still ahead of any recovery. The gap is small, so the selling pressure is easing, but it has not flipped.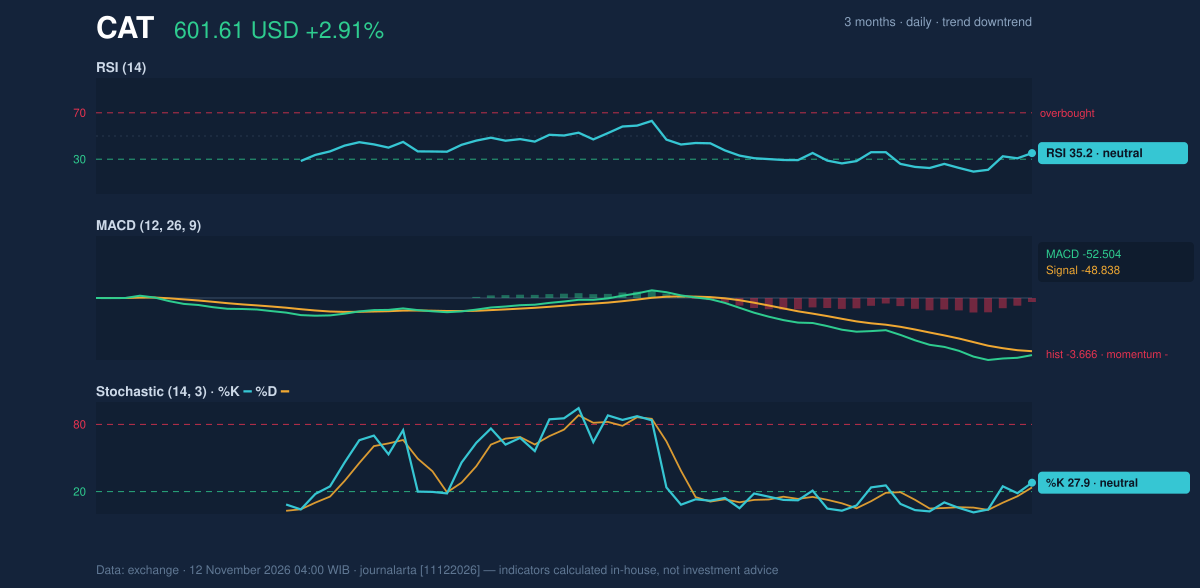
Volatility & Volume
The 14-day Average True Range (ATR), a gauge of typical daily swing, is $31.32, or 5.2% of the price. For a large industrial name that is high. A daily move of that size would take the stock well outside a quiet range. Participation was muted. Volume was 3,673,000 shares, 0.9 times the 20-day average of 3,955,740. A rally on below-average volume has less conviction, and OBV, which tracks whether volume flows into or out of a stock, is still falling. The bounce has not yet drawn in buyers.Fundamental Context
The selloff is not driven by a visible collapse in results. According to its SEC filing, Caterpillar reported quarterly revenue of $20.68 billion for the quarter ended September 30, 2026, up 17.3% from $17.64 billion a year earlier (Form 10-Q, filed November 4). Net income was $3.29 billion against $2.30 billion a year ago, and diluted earnings per share were $7.13. The company also filed a Form 8-K on October 29 covering results and a Regulation FD disclosure. Strong filings next to a falling share price suggest the market is repricing something other than last quarter's numbers. The technical picture is what drives the verdict below.Technical Verdict: HOLD (wait & see)
The JournalArta research score is -50 on a scale where +60 triggers a buy call and -60 a sell call, so the call is HOLD (wait & see). The reasons: - Trend and momentum disagree. The price is below both averages in a downtrend, yet RSI at 35.2 and the Stochastic reading are neutral, not oversold. - Volume does not back the bounce. Volume at 0.9 times normal and falling OBV leave the rebound unconfirmed. - Volatility is wide. With ATR at 5.2% of price and bands still expanding, a break in either direction could be fast. Conditional scenarios from the reference levels: - Upside scenario: entry zone on a close above $740.21 (20-day resistance); target $887.91 (3-month high); protective stop at $658.19 (SMA20). - Downside scenario: entry zone on a break below $553.64 (20-day support); target $532.32 (lower Bollinger band); protective stop at $648.59 (price plus 1.5 times ATR). The neutral view is invalidated if the price breaks below $553.64 or closes above $740.21. In plain terms, the shares have bounced but remain in a downtrend, and the data does not yet show a clear winner.Summary Data CAT
| Last price | 601.61 USD |
| Change 1 day / 5 days / 1 month | 2.91% / 1.74% / -19.68% |
| Trend / MA-cross | downtrend / none |
| SMA20 / SMA50 | 658.19 / 748.51 |
| RSI (14) / Stochastic %K | 35.2 / 27.9 |
| Bollinger %B / ATR | 28% / 31.32 |
| Support / Resistance 20 days | 553.64 / 740.21 |
| Data as of | 12 November 2026 04:00 WIB |
| JournalArta research verdict (score) | Hold (-50) |
Today's full Buy and Sell list for US stocks →
Disclaimer: This technical analysis is generated automatically from exchange data and indicators calculated by JournalArta, for information and education only. The verdict and the entry, target and stop-loss levels are not investment advice or a solicitation to buy or sell any security. Investment decisions and their risks rest solely with the reader.
Track CAT stock price daily: live levels, support/resistance and our full CAT analysis history.