Lloyds Share Price Rises 1.34% on Wednesday, Down 6.4% in a Month
Technical analysis of Lloyds stock on November 11, 2026: price 98.04 GBp, trend downtrend, RSI 44.9, support 93.50, resistance 105.85.

Why Lloyds is in focus today
- MACD histogram has just turned positive
Selected automatically from 98 LSE (UK) stocks by a technical-signal score with daily weighted randomisation — not a recommendation.
Trend & Price Action
The shares trade below both of their key moving averages. The 20-day simple moving average (SMA20) sits at 99.63 and the 50-day (SMA50) at 104.42. The price is below the SMA20, and the SMA20 is itself under the SMA50. A moving average is simply the average closing price over a set number of sessions. When the shorter one sits below the longer one, recent trading has been weaker than the broader run. The 20-day average fell 1.47% over five days. That figure describes the average's slope, not the stock's own move, and it confirms that the drift lower has been persistent rather than a single bad session. No new moving-average crossover has formed. The chart below shows where price sits against these averages, the Bollinger Bands and the nearest support and resistance.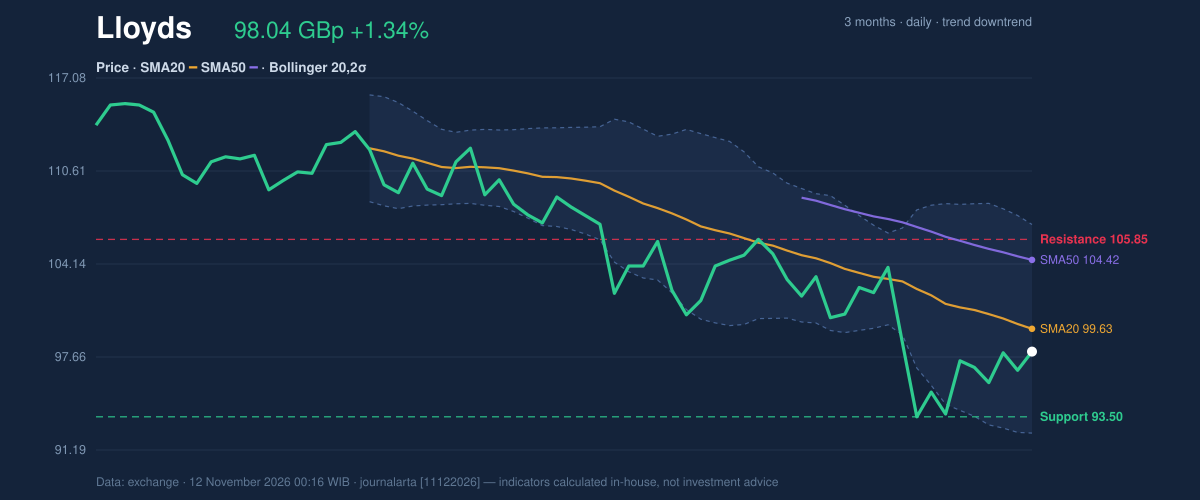
Oscillators & Momentum
Momentum indicators measure how fast price is moving rather than where it is. Here they are neutral, not stretched in either direction. The 14-day Relative Strength Index (RSI) reads 44.9. The scale runs 0 to 100, and readings under 30 are usually called oversold, above 70 overbought. At 44.9 the stock is leaning weak without being washed out. The Stochastic oscillator, which compares the close with the recent trading range, shows %K at 37.1 and %D at 33.7, also neutral. The MACD line is at -2.270, above its signal line at -2.414. The histogram has turned positive at 0.143. The histogram is the gap between the two lines, so a move above zero means downward momentum is easing. It does not mean upward momentum has taken over: the MACD line itself is still negative.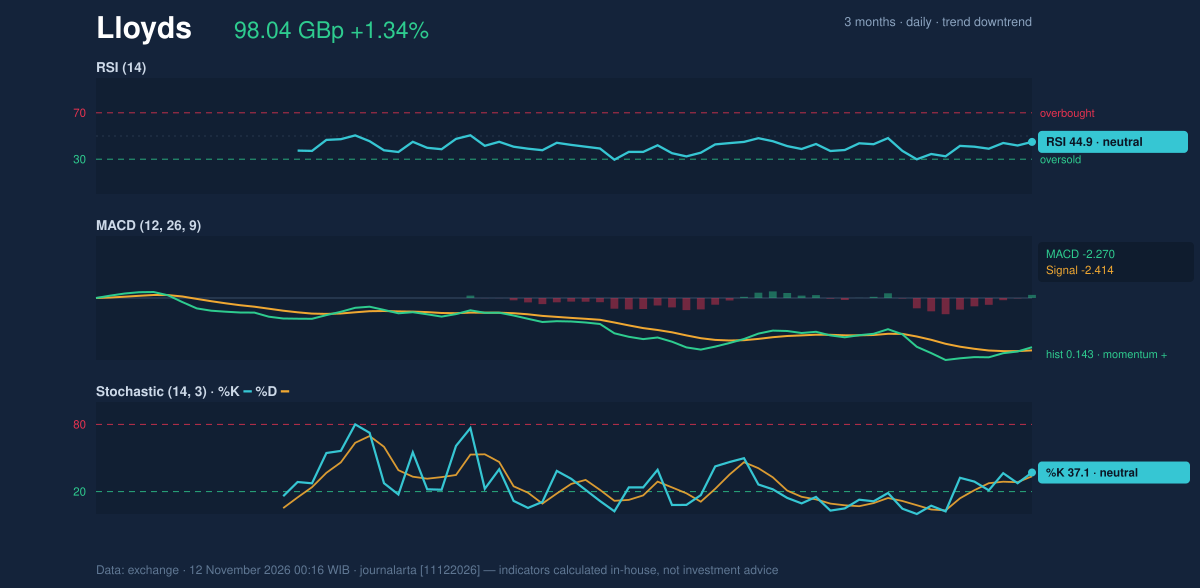
Volatility & Volume
The Bollinger Bands, which mark two standard deviations around the 20-day average, run from 92.37 to 106.89 with the midline at 99.63. The shares sit at 39% of the band width (%B), and the band is 14.6% wide, which the data classes as normal. There is no squeeze that would point to an imminent sharp move. The Average True Range (ATR) is 3.23, or 3.3% of the price. That is moderate volatility: a daily swing of around three pence is ordinary for this stock right now. Volume is where the rebound looks thinnest. The latest session saw 126,254,608 shares change hands, 0.7 times the 20-day average of 174,913,347. On-balance volume (OBV), which adds volume on up days and subtracts it on down days, is falling. Together these suggest the gain came with light participation, and that sellers have still outweighed buyers over the period.Key Levels & Scenarios
Several levels frame what could happen next, all taken from the data: - If the shares close above the 20-day resistance at 105.85, they would also clear the SMA50 at 104.42 and the upper Bollinger Band at 106.89, which would challenge the downtrend reading. - If the shares fail to hold the 20-day support at 93.50, the next reference points are the three-month low at 93.00 and the lower Bollinger Band at 92.37. - A move of 1.5 times the ATR gives 102.89 on the upside and 93.19 on the downside, a rough gauge of the range the recent volatility allows.Technical Verdict: HOLD (wait & see)
The JournalArta research score is -58 on a scale of -100 to +100, short of the -60 threshold for a sell reading and far from the +60 needed for a buy reading. The call is HOLD (wait & see), because trend and momentum are not aligned yet. The strongest reasons: - Trend: price is below the SMA50, the SMA20 is below the SMA50, and the 20-day average is sloping down. - Momentum: the MACD histogram has turned positive, but RSI at 44.9 and Stochastic at 37.1 are neutral, so there is no confirmed reversal. - Volume: falling OBV and volume at 0.7 times average do not back the bounce. The code counts 1 bullish signal against 2 bearish. The verdict would be invalidated if price closes above 105.85, or breaks below 93.50. Conditional scenarios, based only on the reference levels: - Upside scenario: entry zone on a close above 105.85; target 106.89 (upper Bollinger Band), with the 3-month high of 123.10 as the wider reference; protective stop near 102.89. - Downside scenario: triggered by a break below 93.50; reference target 92.37 (lower Bollinger Band), with the 3-month low of 93.00 nearby; protective stop near 99.63 (SMA20). In plain terms, the data shows Lloyds' slide has eased but not reversed, so the technical picture calls for patience until price breaks one of its two key levels. This is technical analysis, not an investment recommendation. | Indicator | Value | |---|---| | Last price | 98.04 GBp (previous close 96.74) | | Change: 1 day / 5 days / 1 month | 1.34% / 0.66% / -6.41% | | SMA20 / SMA50 | 99.63 / 104.42 | | Bollinger (20, 2σ) | 92.37 / 99.63 / 106.89 | | RSI(14) | 44.9 | | Stochastic %K / %D | 37.1 / 33.7 | | MACD / signal / histogram | -2.270 / -2.414 / 0.143 | | ATR(14) | 3.23 | | 20-day support / resistance | 93.50 / 105.85 | | 3-month low / high | 93.00 / 123.10 | Lloyds' latest session volume of 126,254,608 shares compares with a 20-day average of 174,913,347.Summary Data Lloyds
| Last price | 98.04 GBp |
| Change 1 day / 5 days / 1 month | 1.34% / 0.66% / -6.41% |
| Trend / MA-cross | downtrend / none |
| SMA20 / SMA50 | 99.63 / 104.42 |
| RSI (14) / Stochastic %K | 44.9 / 37.1 |
| Bollinger %B / ATR | 39% / 3.23 |
| Support / Resistance 20 days | 93.50 / 105.85 |
| Data as of | 12 November 2026 00:16 WIB |
| JournalArta research verdict (score) | Hold (-58) |
Today's full Buy and Sell list for UK, Singapore & Hong Kong stocks →
Disclaimer: This technical analysis is generated automatically from exchange data and indicators calculated by JournalArta, for information and education only. The verdict and the entry, target and stop-loss levels are not investment advice or a solicitation to buy or sell any security. Investment decisions and their risks rest solely with the reader.
Track Lloyds share price daily: live levels, support/resistance and our full Lloyds analysis history.