Goodman Share Price Technicals: Rises 0.00% on Wednesday, Testing Key Resistance
Technical analysis of Goodman Group stock on November 11, 2026: price 29.39 AUD, trend uptrend, RSI 64.0, support 25.27, resistance 29.39.

Why Goodman Group is in focus today
- Closed at a 20-day high (29.39)
- Uptrend confirmed (5-day change 2.19%)
- Not covered by JournalArta in the last 14 days
Selected automatically from 58 ASX (Australia) stocks by a technical-signal score with daily weighted randomisation — not a recommendation.
Trend & Price Action
The structure is clean. Price sits above the 20-day simple moving average (SMA20) at 27.19, which in turn sits above the 50-day average (SMA50) at 26.78. That ordering is the textbook signature of an uptrend. The 20-day average rose 1.84% over five days, a sign the trend is still building rather than flattening. No new moving-average crossover has formed, so the trend is established, not freshly triggered. The gap between the two averages is narrow, just 0.41 points. That means the rally is young relative to the longer-term base, and the 50-day line has not yet been pulled far from price.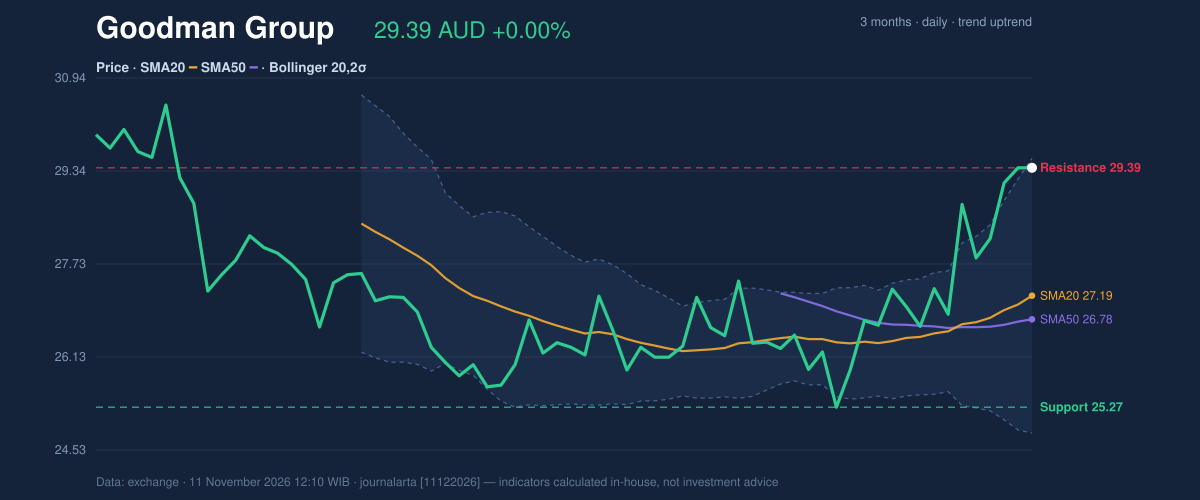
Oscillators & Momentum
Momentum indicators confirm the trend, with one caveat. The Relative Strength Index (RSI, a 0–100 gauge of recent gains versus losses) reads 64.0, in neutral territory. It is firm but well short of the 70 line that usually flags overheating. That matters: price is at a range high while RSI still has headroom. The Stochastic oscillator, which compares the close with the recent high-low range, is more stretched. %K at 98.7 and %D at 96.9 are both in overbought territory. In practice this says the close is pinned at the top of its recent range. Overbought readings can persist for weeks in a healthy trend, but they also raise the odds of a pause or pullback.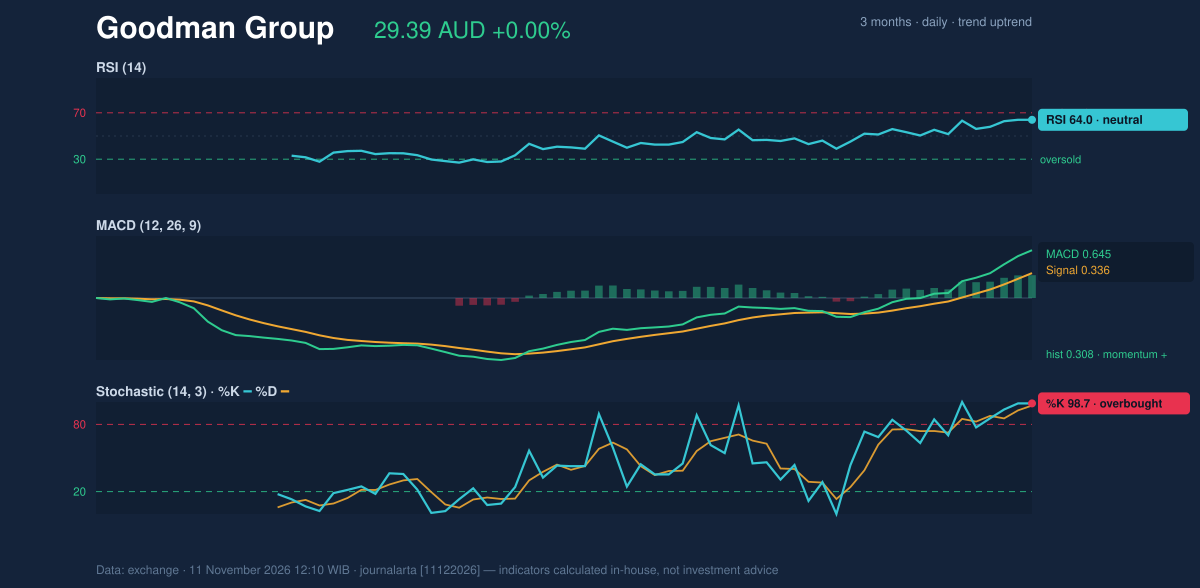
Volatility & Volume
The Average True Range (ATR), a measure of typical daily movement, is 1.11, or 3.8% of the price. That is classed as high volatility, so daily swings of a dollar or so should be expected, and risk levels need to account for that. Volume tells a more cautious story. The latest session traded 3,109,877 shares, about 0.7 times the 20-day average of 4,299,800. A move to a 20-day high on below-average turnover suggests buyers were not rushing in. Still, on-balance volume (OBV), which tallies volume on up days against down days, is rising. That points to accumulation over the broader window and supports the uptrend, even if the latest session was quiet.Key Levels & Scenarios
The immediate test is the 29.39 resistance, which coincides with the close, and just above it the upper Bollinger Band at 29.55. If price clears that zone, the 3-month high of 31.30 comes into view. If the stock fails to hold gains, the first cushion is the SMA20 at 27.19, followed by the 20-day support at 25.27.Technical Verdict: BUY
JournalArta's research model rates Goodman Group BUY, with a score of +68 on a scale of −100 to +100 (the threshold is +60). The strongest reasons: - Trend structure: price is above the SMA50, and the SMA20 is above the SMA50, confirming an uptrend. - Momentum zone: RSI at 64.0 sits in the healthy 50–70 band, with MACD positive and above its signal line. - Participation: rising OBV confirms the uptrend, giving one bullish technical signal against none bearish. Levels computed by the model, valid until 9 December 2026: - Entry range: A$28.56 – A$29.39 - Exit target 1: A$32.24 (reward/risk 1.5) - Exit target 2: A$35.09 (reward/risk 3.0) - Stop loss: A$27.49 The verdict is invalidated if price falls below the A$27.49 stop level. Risks worth noting are the overbought Stochastic at 98.7 and the lighter volume at 0.7 times average. In plain terms: the indicators lean positive for Goodman Group, though the stock is already stretched near the top of its range. This is technical analysis, not investment advice. | Indicator | Value | |---|---| | Last price | A$29.39 | | Change (1 day / 5 days / 1 month) | 0.00% / 2.19% / 11.45% | | SMA20 / SMA50 | 27.19 / 26.78 | | Bollinger (upper / mid / lower) | 29.55 / 27.19 / 24.82 | | %B / band width | 97% / 17.4% | | RSI(14) | 64.0 | | Stochastic %K / %D | 98.7 / 96.9 | | MACD / signal / histogram | 0.645 / 0.336 / 0.308 | | ATR(14) | 1.11 (3.8%) | | Volume vs 20-day average | 0.7× | | 20-day support / resistance | 25.27 / 29.39 | | 3-month low / high | 24.70 / 31.30 | The JournalArta research verdict on Goodman Group is valid until 9 December 2026.Summary Data Goodman Group
| Last price | 29.39 AUD |
| Change 1 day / 5 days / 1 month | 0.00% / 2.19% / 11.45% |
| Trend / MA-cross | uptrend / none |
| SMA20 / SMA50 | 27.19 / 26.78 |
| RSI (14) / Stochastic %K | 64.0 / 98.7 |
| Bollinger %B / ATR | 97% / 1.11 |
| Support / Resistance 20 days | 25.27 / 29.39 |
| Data as of | 11 November 2026 12:10 WIB |
| JournalArta research verdict (score) | Buy (+68) |
| Entry zone | 28.56 – 29.39 |
| Target 1 / 2 | 32.24 / 35.09 |
| Stop loss | 27.49 |
| Reward/risk | 1.5 / 3.0 |
Disclaimer: This technical analysis is generated automatically from exchange data and indicators calculated by JournalArta, for information and education only. The verdict and the entry, target and stop-loss levels are not investment advice or a solicitation to buy or sell any security. Investment decisions and their risks rest solely with the reader.
Track Goodman Group share price daily: live levels, support/resistance and our full Goodman Group analysis history.