National Australia Share Price Technicals: Falls 0.00% on Wednesday, Testing Support Level
Technical analysis of NAB stock on November 11, 2026: price 38.56 AUD, trend sideways, RSI 42.3, support 38.56, resistance 41.51.

Why NAB is in focus today
- Closed at a 20-day low (38.56)
- Not covered by JournalArta in the last 14 days
Selected automatically from 58 ASX (Australia) stocks by a technical-signal score with daily weighted randomisation — not a recommendation.
Trend & Price Action
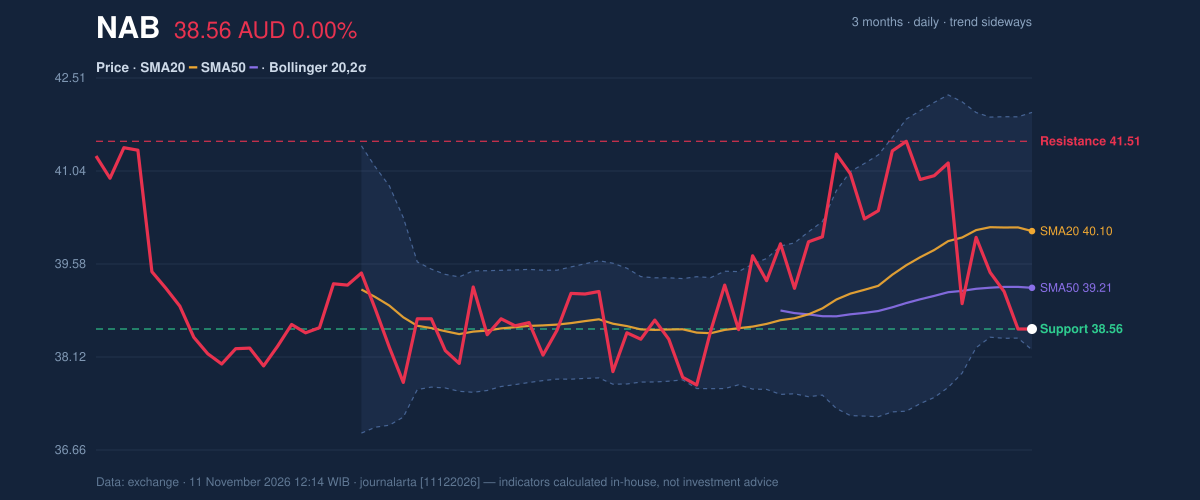
The slide is slow, not violent. The trend reads as sideways, and the 20-day average rose 0.25% over five days, so the broader drift has not turned decisively lower. But price now sits below the 20-day average at A$40.10 and below the 50-day average at A$39.21. The 20-day average is still above the 50-day, and DATA records no fresh moving-average crossover. In plain terms, the longer-term picture has not broken, yet the shares have slipped under both yardsticks. That gap matters. A stock trading under both averages is being sold into rather than bought on dips. The 3-month range runs from a low of A$37.29 to a high of A$41.93, and NAB is hugging the lower third of it. The 20-day range spans A$38.56 to A$41.51, which puts the latest close at 0% of the range, right on the floor.Oscillators & Momentum
Momentum is soft and leaning the wrong way. The 14-day RSI, a gauge of buying versus selling pressure on a 0–100 scale, is 42.3, which is neutral. It is not yet depressed enough to suggest sellers are exhausted. The Stochastic oscillator tells a sharper story. Its %K reading of 16.2 and %D of 21.1 both sit in oversold territory, meaning the close is near the bottom of its recent range. Oversold readings can precede a bounce, but they can also persist while a stock keeps sliding, so they are a warning light rather than a turn signal.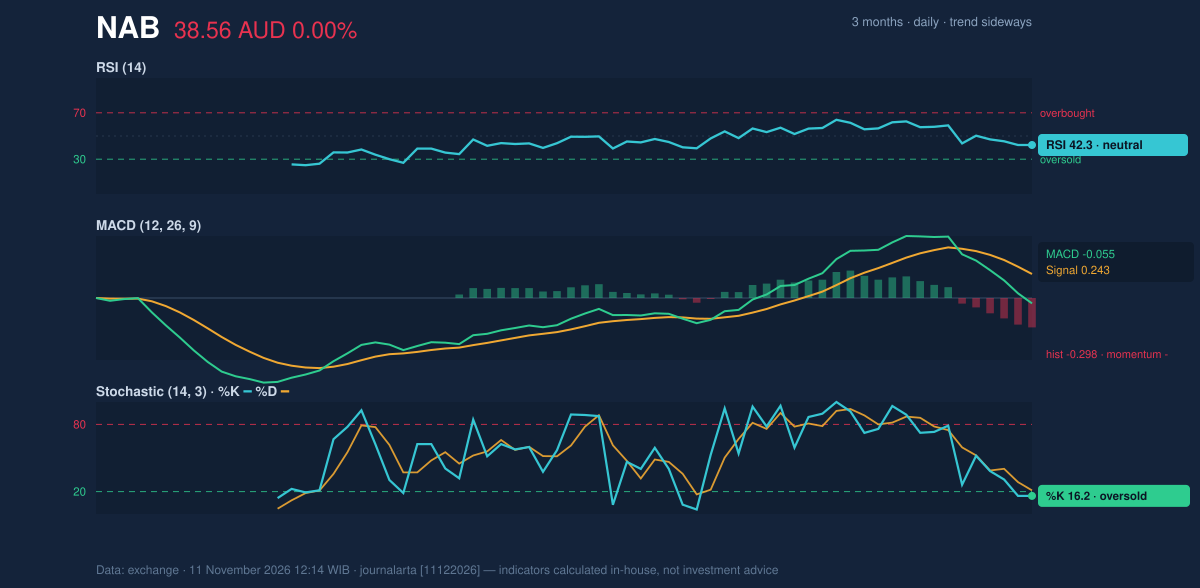
Volatility & Volume
Bollinger Bands, which draw a channel two standard deviations around the 20-day average, span A$38.23 to A$41.97. The band width of 9.3% is normal, so there is no squeeze hinting at a sudden breakout. NAB's close sits at a %B of 9%, just above the lower band at A$38.23. Price is pressing the edge of its usual envelope without having burst through it. The 14-day ATR, a measure of typical daily swing, is A$1.08, or 2.8% of the price, which counts as moderate volatility. Volume reinforces the cautious reading: 6,819,690 shares changed hands, about 1.1 times the 20-day average of 6,421,976. That is a touch above normal, not a capitulation. On-balance volume, which tallies volume on up days versus down days, is falling, so selling has carried slightly more weight than buying.Key Levels & Scenarios
The levels are tightly stacked. Support at A$38.56 is the line in the sand, with the 3-month low of A$37.29 and the ATR-based level of A$36.94 beneath it. Overhead, resistance sits at A$41.51, with the 3-month high at A$41.93 just above. If NAB closes below A$38.56, the next reference points are A$37.29 and then A$36.94. If it instead holds and climbs back through the 20-day average near A$40.10, a retest of A$41.51 becomes the relevant question.Technical Verdict: HOLD (wait & see)
The JournalArta research score is -20 on a scale running from -100 to +100, well short of the -60 needed for a sell call and the +60 needed for a buy call. The call is HOLD (wait & see) because trend and momentum have not aligned. Reasons: - Price is below its 50-day average, and the MACD histogram is at -0.298, so momentum is negative. - The Stochastic at 16.2/21.1 is oversold while the RSI at 42.3 is only neutral, a mixed signal that does not confirm a reversal. - The 20-day average still sits above the 50-day, so the structure has not broken down. Conditional scenarios, drawn only from the reference levels: - Upside scenario: a close above the 20-day resistance at A$41.51. - Entry range: A$41.51 and above. - Exit target: A$41.93 (3-month high). - Stop loss: A$40.18 (price + 1.5×ATR level). - Downside scenario: a break below the 20-day support at A$38.56. - Entry range: below A$38.56. - Exit target: A$37.29 (3-month low). - Stop loss: A$40.10 (20-day average). The verdict is invalidated if price breaks below A$38.56 on a closing basis, or closes above A$41.51. For non-traders: NAB is resting at its recent floor with no clear signal in either direction, so the chart favors waiting for a decisive move. This is technical analysis, not an investment recommendation. | Metric | Value | |---|---| | Last price | A$38.56 | | Change (1 day / 5 days / 1 month) | 0.00% / -1.03% / -2.90% | | SMA20 / SMA50 | A$40.10 / A$39.21 | | Bollinger (lower / middle / upper) | A$38.23 / A$40.10 / A$41.97 | | RSI(14) | 42.3 | | Stochastic %K / %D | 16.2 / 21.1 | | MACD / signal / histogram | -0.055 / 0.243 / -0.298 | | ATR(14) | A$1.08 (2.8%) | | Volume vs 20-day average | 1.1× | | 20-day support / resistance | A$38.56 / A$41.51 | | 3-month low / high | A$37.29 / A$41.93 | Trading volume on November 11 reached 6,819,690 shares.Summary Data NAB
| Last price | 38.56 AUD |
| Change 1 day / 5 days / 1 month | 0.00% / -1.03% / -2.90% |
| Trend / MA-cross | sideways / none |
| SMA20 / SMA50 | 40.10 / 39.21 |
| RSI (14) / Stochastic %K | 42.3 / 16.2 |
| Bollinger %B / ATR | 9% / 1.08 |
| Support / Resistance 20 days | 38.56 / 41.51 |
| Data as of | 11 November 2026 12:14 WIB |
| JournalArta research verdict (score) | Hold (-20) |
Today's full Buy and Sell list for US stocks →
Disclaimer: This technical analysis is generated automatically from exchange data and indicators calculated by JournalArta, for information and education only. The verdict and the entry, target and stop-loss levels are not investment advice or a solicitation to buy or sell any security. Investment decisions and their risks rest solely with the reader.
Track NAB share price daily: live levels, support/resistance and our full NAB analysis history.