Barclays Share Price Update: Rises 1.09%, Flat Over the Past Month
Technical analysis of Barclays stock on November 11, 2026: price 434.75 GBp, trend sideways, RSI 51.5, support 407.00, resistance 434.75.

Barclays closed at 434.75 pence on Wednesday, November 11, 2026, the highest close in 20 sessions and a gain of 1.09% on the day. The move sits on a flat backdrop: the shares are up just 0.01% over five days and 0.68% over a month. A stock that finishes at a 20-day peak while barely moving over the week is testing a ceiling, not breaking away from the pack. Whether it clears that ceiling is the question the indicators try to answer.
Why Barclays is in focus today
- Closed at a 20-day high (434.75)
- Not covered by JournalArta in the last 14 days
Selected automatically from 98 LSE (UK) stocks by a technical-signal score with daily weighted randomisation — not a recommendation.
Trend & Price Action
The price sits above its 20-day simple moving average (SMA20) at 423.55 but below the 50-day average (SMA50) at 447.12. A shorter average beneath a longer one usually describes a market that has lost ground over recent weeks and is now attempting a recovery. The 20-day average itself slopes down by 0.27% over five days, which is the movement of the average, not of the share price. No new moving-average crossover has formed.
The shares are also well off their highs. The three-month range runs from a low of 399.60 to a high of 525.10, so the stock trades roughly 17% below its peak. That context matters: today's 20-day high is a local feature inside a wider pullback.
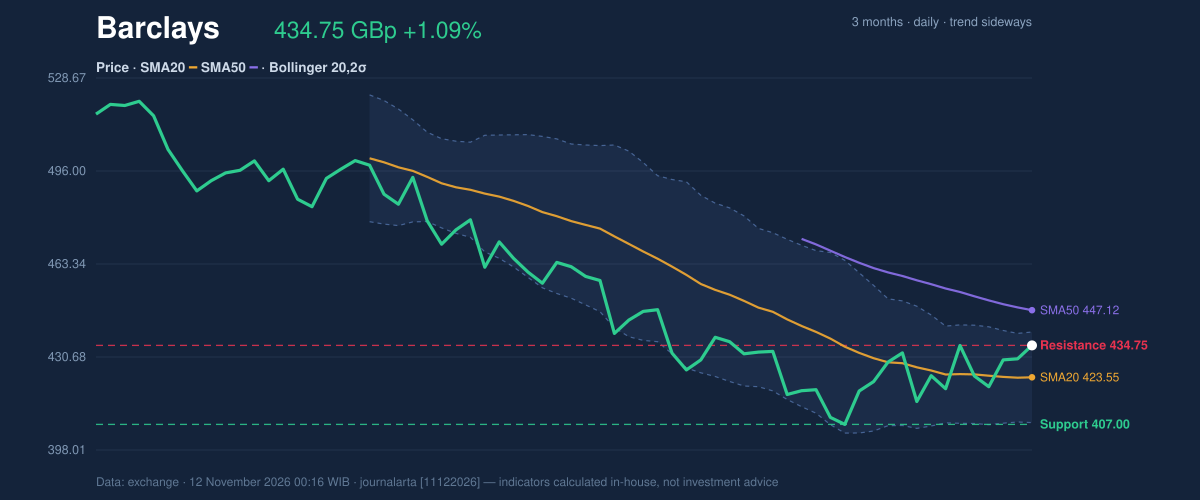
As shown in the chart, price has climbed back through the 20-day average and now touches the top of its recent range. Our code flags one bearish technical signal and no bullish ones: a bounce into the SMA20 while price remains below the SMA50, a pattern that often marks a pause within a downtrend rather than a reversal.
Trend and momentum are not yet in agreement.
Oscillators & Momentum
The Relative Strength Index (RSI), which measures how strongly buyers or sellers have dominated recent sessions on a scale of 0 to 100, reads 51.5. That is neutral: neither stretched nor exhausted. The Stochastic oscillator, which compares the close with the recent trading range, shows %K at 73.5 and %D at 66.7. Also neutral, though leaning toward the upper end, as expected after a close at the top of the range.
The MACD line, a gauge of the gap between short- and long-term averages, stands at -4.264 against a signal line of -7.442. The histogram is positive at 3.178, meaning momentum has improved. But the MACD line is still below zero, so the improvement is a recovery from weakness rather than evidence of strength.
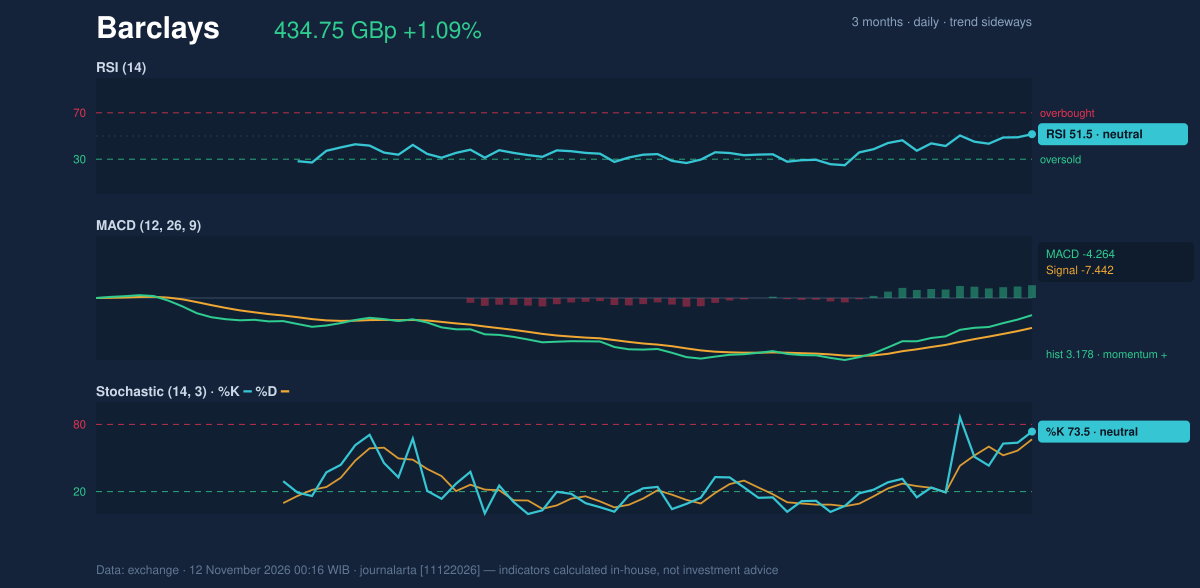
Taken together, the oscillators confirm a stabilising picture without signalling a decisive turn.
Volatility & Volume
Bollinger Bands, which wrap two standard deviations around the 20-day average, span 407.63 to 439.47. Price sits at 85% of the band (%B), near the upper edge. The band width has narrowed to 7.5%, a squeeze, which typically means volatility has compressed and a larger move in either direction becomes more plausible. A squeeze does not indicate which way.
The Average True Range (ATR), a measure of typical daily movement, is 14.25 pence, or 3.3% of the price: moderate volatility.
Volume is the weak link. Wednesday's turnover of 31.7 million shares was only 0.6 times the 20-day average of 51.7 million, and On-Balance Volume (OBV), which accumulates volume on up days and subtracts it on down days, is falling. A push to a 20-day high on thin trading suggests few participants are committed to the move. Breakouts on light volume are more prone to fading.
Key Levels & Scenarios
The 20-day resistance is 434.75, exactly where the stock closed, so price sits at 100% of its 20-day range. The 20-day support is 407.00, with the three-month low at 399.60 below it. Using the ATR, price minus 1.5 times ATR gives 413.38; price plus 1.5 times ATR gives 456.12.
Two conditional scenarios follow. If the shares close above 434.75 on firmer volume, the squeeze could resolve upward, with the upper Bollinger Band at 439.47 and the 50-day average at 447.12 as the next reference points. If the shares fail to hold and break below 407.00, the structure of the past month would be damaged, and 399.60 would come into view.
Technical Verdict: HOLD (wait & see)
The JournalArta research score is -28 on a scale of -100 to +100, short of the -60 threshold for a sell call and well below the +60 needed for a buy call. The call is HOLD (wait & see).
The strongest reasons:
- Trend: price remains below the SMA50 (447.12) and the 20-day average sits below the 50-day.
- Volume: trading at 0.6 times normal with a falling OBV does not confirm the move to a 20-day high.
- Momentum: RSI at 51.5 and a positive MACD histogram show improvement but no decisive direction.
Conditional scenario levels, drawn only from the reference levels:
- Upside scenario, entry range: a close above 434.75, toward the upper Bollinger Band at 439.47.
- Upside scenario, exit target: 456.12 (price plus 1.5 times ATR).
- Upside scenario, stop loss: below 423.55 (SMA20).
- Downside scenario, trigger: a break below 407.00, with 399.60 as the next reference.
- Downside scenario, stop loss: a close back above 413.38 (price minus 1.5 times ATR) would weaken the case.
The verdict is invalidated if price breaks below 407.00 or closes decisively above 434.75 with strong volume.
In plain terms: the signals do not yet agree, so the technical picture says to wait for a clearer move rather than act now.
| Indicator | Value |
|---|---|
| Last price (Nov 11, 2026) | 434.75 GBp (prev close 430.05) |
| Change: 1 day / 5 days / 1 month | 1.09% / 0.01% / 0.68% |
| SMA20 / SMA50 | 423.55 / 447.12 |
| Bollinger (20, 2σ) | 407.63 / 423.55 / 439.47; %B 85%; width 7.5% |
| RSI(14) | 51.5 (neutral) |
| Stochastic %K / %D | 73.5 / 66.7 |
| MACD / signal / histogram | -4.264 / -7.442 / 3.178 |
| ATR(14) | 14.25 (3.3% of price) |
| Volume vs 20-day average | 31,710,889 vs 51,676,128 (0.6×) |
| 20-day support / resistance | 407.00 / 434.75 |
| 3-month low / high | 399.60 / 525.10 |
Summary Data Barclays
| Last price | 434.75 GBp |
| Change 1 day / 5 days / 1 month | 1.09% / 0.01% / 0.68% |
| Trend / MA-cross | sideways / none |
| SMA20 / SMA50 | 423.55 / 447.12 |
| RSI (14) / Stochastic %K | 51.5 / 73.5 |
| Bollinger %B / ATR | 85% / 14.25 |
| Support / Resistance 20 days | 407.00 / 434.75 |
| Data as of | 12 November 2026 00:16 WIB |
| JournalArta research verdict (score) | Hold (-28) |
Today's full Buy and Sell list for UK, Singapore & Hong Kong stocks →
Disclaimer: This technical analysis is generated automatically from exchange data and indicators calculated by JournalArta, for information and education only. The verdict and the entry, target and stop-loss levels are not investment advice or a solicitation to buy or sell any security. Investment decisions and their risks rest solely with the reader.
Track Barclays share price daily: live levels, support/resistance and our full Barclays analysis history.