AstraZeneca Share Price Latest: Rises 0.09% on Wednesday, Up 13% in a Month
Technical analysis of AstraZeneca stock on November 11, 2026: price 13,896.00 GBp, trend uptrend, RSI 66.2, support 12,400.00, resistance 14,066.00.
By matthew jonathan
November 12, 20265 min read
Advertisement
Logo AstraZeneca — JournalArta illustration
AstraZeneca shares closed Wednesday's session on the London Stock Exchange at 13,896.00 pence, up 0.09% on the day from a previous close of 13,884.00 pence, according to exchange data for November 11, 2026. The stock has gained 12.98% over the past month, yet it has slipped 0.91% across the last five days. That mix of a strong monthly climb and a short pause is what makes the chart worth reading closely.
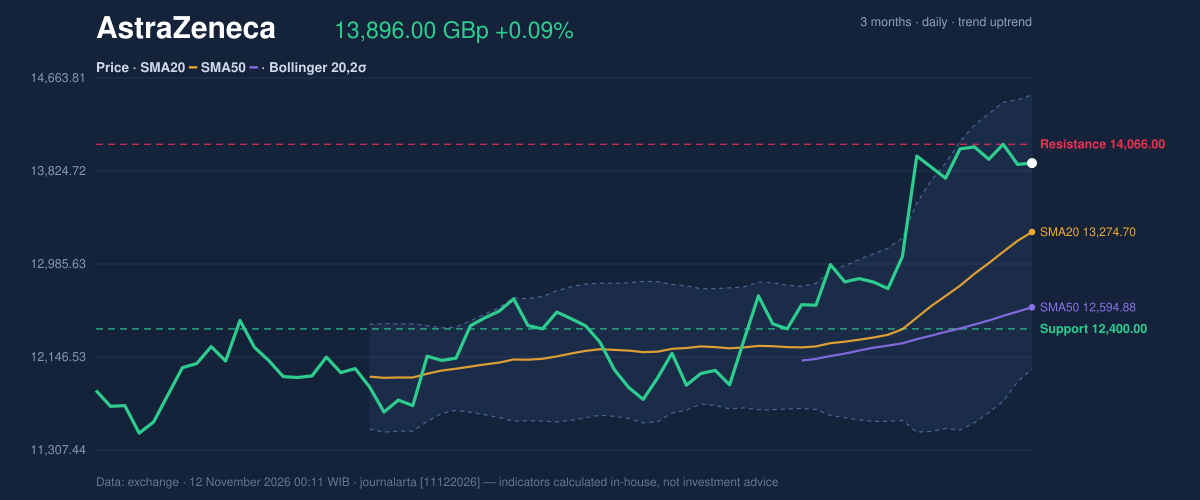
The share price now sits at 90% of its 20-day range, close to the top. The 20-day resistance is 14,066.00 pence, just 170 pence away. The three-month high of 14,312.00 pence is not much farther.
Trend & Price Action
The trend is firmly upward. The price is above the 20-day simple moving average (SMA20) at 13,274.70 pence, and that average sits above the 50-day line at 12,594.88 pence. A simple moving average is the mean closing price over a set number of sessions, so a stock holding above both lines has been bought at progressively higher levels. The 20-day average rose 3.79% over five days, which shows how quickly the recent base is rising. It is the slope of the average, not the share price's own gain.
No new moving-average cross has formed. The 20-day line already sits above the 50-day, so the bullish setup is established rather than fresh. Traders reading a cross as a starting gun would find nothing new here.
3-month price action chart of AstraZeneca: price, SMA20/50, Bollinger, support & resistance.
Advertisement
As the chart shows, price has moved from the middle of the Bollinger range toward the upper band. The shares trade roughly 620 pence above the 20-day average, a gap that usually narrows when a rally pauses.
Oscillators & Momentum
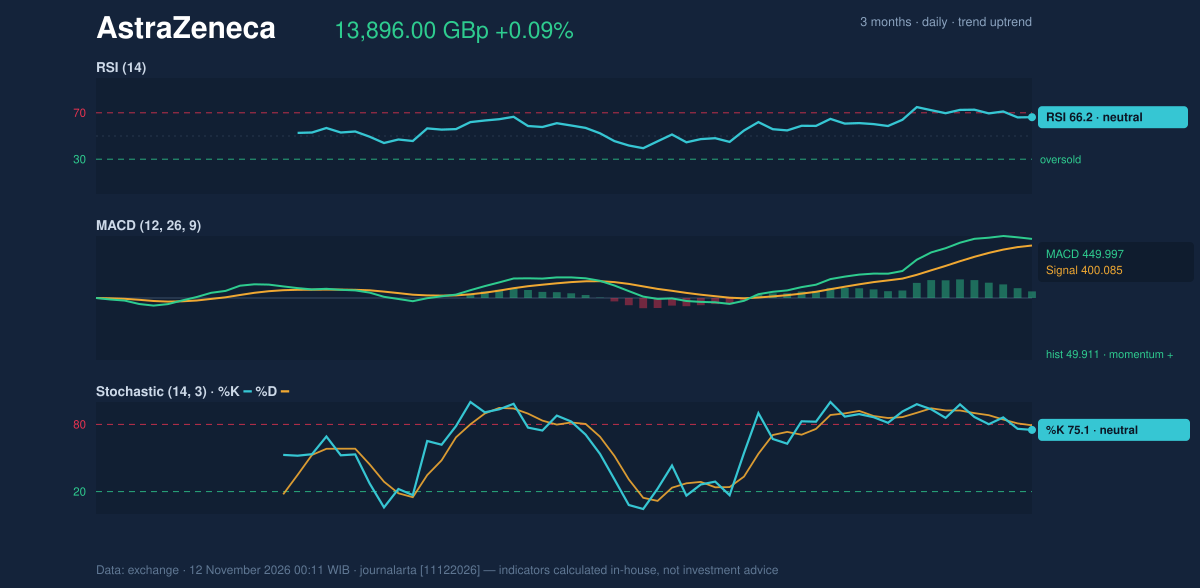
Momentum supports the trend without signalling excess. The 14-day Relative Strength Index (RSI), which scores recent gains against losses on a 0–100 scale, reads 66.2. That is in neutral territory, below the 70 line often treated as overbought, but near enough to it that further gains would push it into that zone quickly.
The Stochastic oscillator tells a similar story. Its %K line is at 75.1 and %D at 79.2, both neutral. The faster %K line sitting below %D hints that short-term buying pressure has eased slightly, consistent with the 0.91% five-day dip.
The MACD, which tracks the gap between fast and slow moving averages, stands at 449.997 against a signal line of 400.085. The histogram is positive at 49.911, so momentum is still pointing up. It is a modest margin, however, and a shrinking histogram would be the first sign of fatigue.
Momentum chart of AstraZeneca: RSI(14), MACD, Stochastic.
Advertisement
Volatility & Volume
The Bollinger Bands, which draw a channel two standard deviations around the 20-day average, run from 12,038.15 to 14,511.25 pence. The band width of 18.6% is normal, so the market is neither coiled in a squeeze nor in a volatility spike. The %B reading of 75% puts the price in the upper part of the channel, with about 615 pence of room to the upper band.
The 14-day Average True Range (ATR), a measure of typical daily movement, is 349.43 pence, or 2.5% of the price. That is moderate volatility. A daily swing of that size would be ordinary for this stock, not a signal in itself.
Volume is the weaker link. Wednesday's turnover of 1,328,928 shares was only 0.5 times the 20-day average of 2,812,258, which marks a thin session. Light volume on a quiet day is not alarming on its own. On-balance volume (OBV), which accumulates volume on up days and subtracts it on down days, is still rising, so the longer-term pattern shows participation behind the advance. The code-computed signal count reflects this: one bullish signal, an uptrend confirmed by rising OBV, and none bearish.
Advertisement
Key Levels & Scenarios
The nearest ceiling is the 20-day resistance at 14,066.00 pence, with the three-month high of 14,312.00 pence behind it. On the downside, the 20-day support is 12,400.00 pence, with the three-month low at 11,404.00 pence. The 20-day average at 13,274.70 pence is the first cushion before that support.
Two conditional scenarios follow from these levels. If the shares close above 14,066.00 pence, the way would open toward the three-month high and the upper Bollinger band near 14,511.25 pence. If they fail to hold 12,400.00 pence, the uptrend structure would be damaged and the lower band near 12,038.15 pence comes into view. The ATR-based markers, 13,371.86 pence (price minus 1.5 times ATR) and 14,420.14 pence (price plus 1.5 times ATR), give a sense of the normal range around the current level.
Technical Verdict: HOLD (wait & see)
JournalArta's research model scores AstraZeneca at +58 on a scale of −100 to +100, just short of the +60 needed for a Buy call, which keeps the verdict at HOLD (wait & see). The strongest reasons:
- Trend: the price is above both the 20-day and 50-day averages, and the 20-day average sits above the 50-day.
- Momentum: RSI at 66.2 and the positive MACD histogram confirm direction, but the Stochastic %K below %D and the 0.91% five-day dip show buying has paused.
- Participation: volume at 0.5 times its average does not yet confirm a push higher, even though OBV is rising.
Conditional scenario levels, computed from the data:
- Upside scenario entry: a close above the 20-day resistance at 14,066.00 pence.
- Upside exit target: the three-month high at 14,312.00 pence, then the upper Bollinger band at 14,511.25 pence.
- Downside scenario: a break of the 20-day support at 12,400.00 pence.
- Stop-loss reference: 13,371.86 pence (price minus 1.5 times ATR) for the current level; 12,400.00 pence for a longer-term position.
The verdict is invalidated if price breaks below 12,400.00 pence.
In plain terms, the share price is rising and the trend is healthy, but it is close to its recent ceiling and trading volume is light, so the data does not yet make a decisive case either way.
This is technical analysis, not an investment recommendation, and the site disclaimer applies.
Disclaimer: This technical analysis is generated automatically from exchange data and indicators calculated by JournalArta, for information and education only. The verdict and the entry, target and stop-loss levels are not investment advice or a solicitation to buy or sell any security. Investment decisions and their risks rest solely with the reader.