Spirax Share Price Latest: Climbs 3.60% on Wednesday, Trading Volume 1.6x Normal
Technical analysis of Spirax stock on November 11, 2026: price 7,620.00 GBp, trend uptrend, RSI 62.3, support 7,230.00, resistance 7,620.00.
Spirax Group shares closed at 7,620.00 pence on the London Stock Exchange on Wednesday, November 11, 2026, up 3.60% from the previous close of 7,355.00. It was the highest close in 20 sessions. The move came on volume of 322,599 shares, 1.6 times the 20-day average of 196,291, and left the stock just under its three-month high of 7,705.00.
Why Spirax is in focus today
- One-day move of 3.60%, about 1.5× its average daily range (ATR)
- Volume at 1.6× the 20-day average
- Closed at a 20-day high (7,620.00)
- Trading near its 3-month high (7,705.00)
- Breaking out of a Bollinger squeeze (band width 5.7%)
- Uptrend confirmed (5-day change 3.81%)
Selected automatically from 98 LSE (UK) stocks by a technical-signal score with daily weighted randomisation — not a recommendation.
Gains of 3.81% over five days and 4.03% over one month show the jump was not a one-day spike. It extended a climb already in place.
Trend & Price Action
The structure is a clean uptrend. The price sits above both the 20-day simple moving average (SMA20) at 7,390.75 and the 50-day average (SMA50) at 7,203.60. The 20-day average itself rose 0.54% over five days. That is the slope of the average, not the stock's own gain, but it shows the short-term base moving up. No new moving-average crossover has formed, so the 20-day line sitting above the 50-day line is an established condition rather than a fresh signal.
As shown in the chart below, the close landed at the top of the 20-day range, with support at 7,230.00 and resistance at 7,620.00.
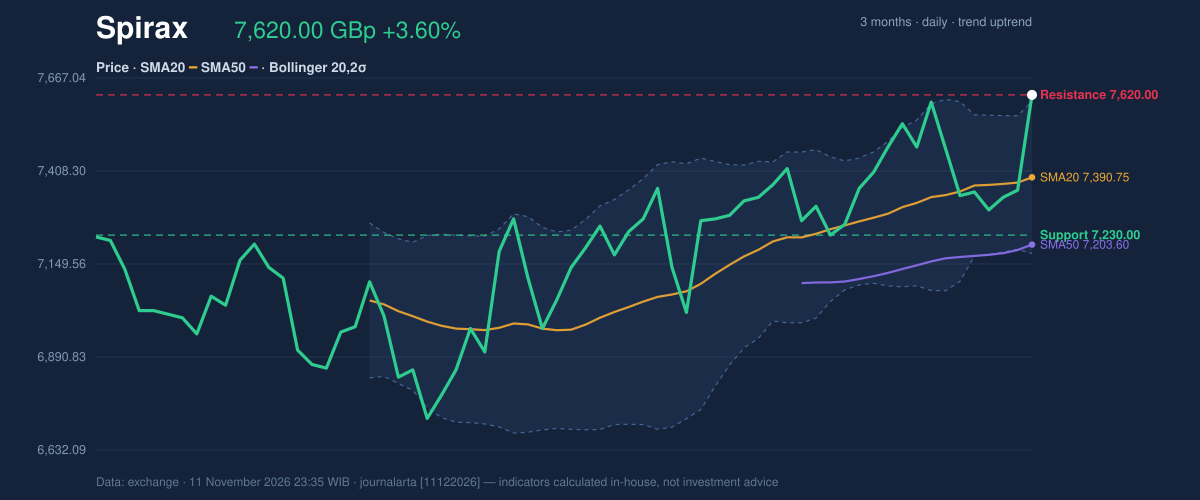
A close exactly on the 20-day high matters because it tests whether buyers will keep paying up. The three-month ceiling of 7,705.00 is only 85 pence away, and the three-month floor of 6,675.00 is far behind. At 7,620.00, the stock sits at 100% of its 20-day range.
Oscillators & Momentum
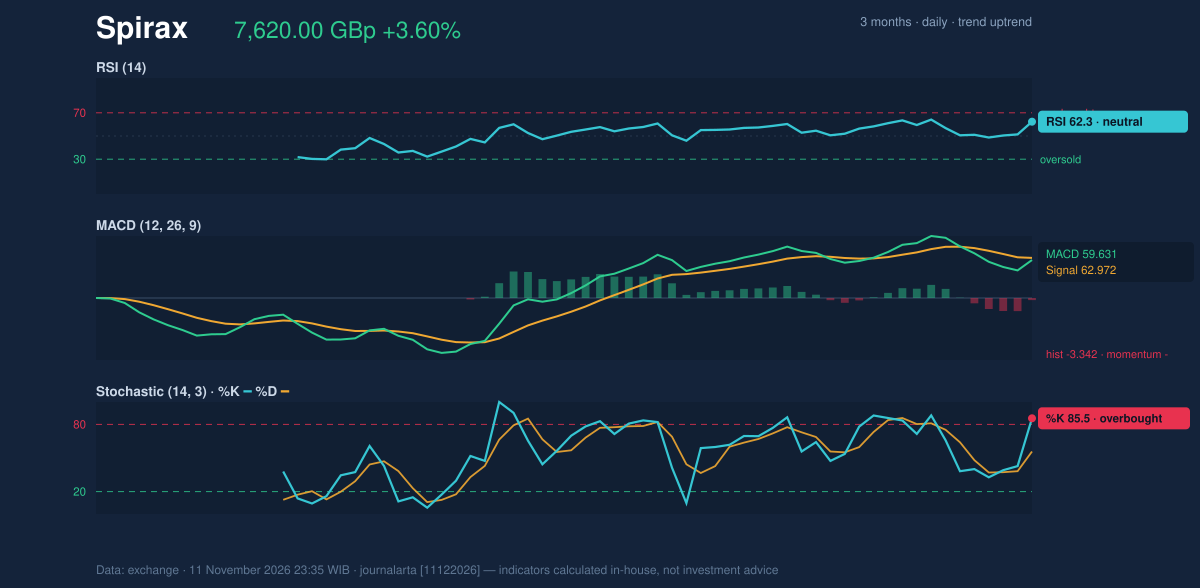
Momentum indicators are more mixed than the price chart. The 14-day Relative Strength Index (RSI), which measures the speed of recent gains on a 0–100 scale, reads 62.3, classed as neutral. That leaves room to rise before the stock would look stretched on that gauge.
The Stochastic oscillator is less relaxed. Its %K line is at 85.5 against a %D of 55.8, in overbought territory. The reading says the close sits near the top of its recent range, which is what a breakout day produces. It does not by itself predict a reversal, but it shows how much of the move is already in the price.
The MACD, a trend-following gauge built from two moving averages, shows a line of 59.631 against a signal of 62.972. The histogram is -3.342, meaning momentum is negative on this measure. A MACD that lags after a 3.6% one-day jump suggests the earlier gains were gradual, and this indicator is slower to register the sudden move.
Volatility & Volume
The Bollinger Bands, which draw a channel two standard deviations around the 20-day average, were narrow at 5.7% wide. Narrow bands often precede a larger move, and Wednesday's close resolved that squeeze to the upside. The close of 7,620.00 is above the upper band at 7,603.01, putting %B at 104%. The lower band is at 7,178.49 and the middle at 7,390.75.
The 14-day Average True Range (ATR) is 188.70 pence, or 2.5% of the price, which is moderate volatility. The 3.60% gain was roughly 1.5 times that typical daily range, so the move was larger than normal without being extreme.
Volume supports the breakout. A close at a 20-day high on 1.6 times average turnover suggests real participation rather than a thin-market drift. On-balance volume (OBV), which adds volume on up days and subtracts it on down days, is rising, consistent with buyers leading the advance.
Key Levels & Scenarios
The 7,620.00 level, the 20-day high, is now the line to watch. Holding at or above it would keep the breakout intact, with the three-month high of 7,705.00 the next reference. A slide back below the upper Bollinger band at 7,603.01 would suggest the breakout is being tested, with the SMA20 at 7,390.75 and the 20-day support at 7,230.00 below it.
Technical Verdict: BUY
JournalArta's research model scores Spirax at +97 on a scale of −100 to +100, where +60 or above counts as BUY. Four bullish signals were active against none bearish. The strongest reasons:
- Breakout on volume: the close at the 20-day high came on volume 1.6 times the 20-day average.
- Bollinger squeeze resolved upward: the close of 7,620.00 is above the upper band at 7,603.01.
- Trend alignment: price is above both averages, the 20-day average is above the 50-day, and OBV is rising.
Risks are visible in the same data: Stochastic %K at 85.5 is overbought, and the MACD histogram is negative at -3.342. The verdict is invalidated if the price falls below the 7,192.20 stop level.
- Entry range: 7,478.27 – 7,620.00 GBp
- Exit target 1: 8,261.70 GBp (reward/risk 1.5)
- Exit target 2: 8,903.40 GBp (reward/risk 3.0)
- Stop loss: 7,192.20 GBp
These levels are valid until 9 December 2026. In plain terms, the chart data currently leans in favour of the shares continuing higher, provided they stay above the stop level. This is technical analysis, not an investment recommendation.
Summary Data Spirax
| Last price | 7,620.00 GBp |
| Change 1 day / 5 days / 1 month | 3.60% / 3.81% / 4.03% |
| Trend / MA-cross | uptrend / none |
| SMA20 / SMA50 | 7,390.75 / 7,203.60 |
| RSI (14) / Stochastic %K | 62.3 / 85.5 |
| Bollinger %B / ATR | 104% / 188.70 |
| Support / Resistance 20 days | 7,230.00 / 7,620.00 |
| Data as of | 11 November 2026 23:35 WIB |
| JournalArta research verdict (score) | Buy (+97) |
| Entry zone | 7,478.27 – 7,620.00 |
| Target 1 / 2 | 8,261.70 / 8,903.40 |
| Stop loss | 7,192.20 |
| Reward/risk | 1.5 / 3.0 |
Today's full Buy and Sell list for UK, Singapore & Hong Kong stocks →
Disclaimer: This technical analysis is generated automatically from exchange data and indicators calculated by JournalArta, for information and education only. The verdict and the entry, target and stop-loss levels are not investment advice or a solicitation to buy or sell any security. Investment decisions and their risks rest solely with the reader.
Track Spirax share price daily: live levels, support/resistance and our full Spirax analysis history.