London Stock Exchange Share Price on Wednesday: Climbs 2.60%, Up 14.8% in a Month
Technical analysis of LSEG stock on November 11, 2026: price 9,638.00 GBp, trend uptrend, RSI 62.9, support 8,684.00, resistance 9,790.00.

London Stock Exchange Group (LSEG.L) rose 2.60% on Wednesday, November 11, 2026, closing at 9,638.00 pence against a previous close of 9,394.00. The one-day gain sits awkwardly beside a five-day change of -1.55%, while the one-month change is +14.77%. A strong month, a soft week and a firm day make this a stock worth reading closely, because the signals disagree.
Trend & Price Action
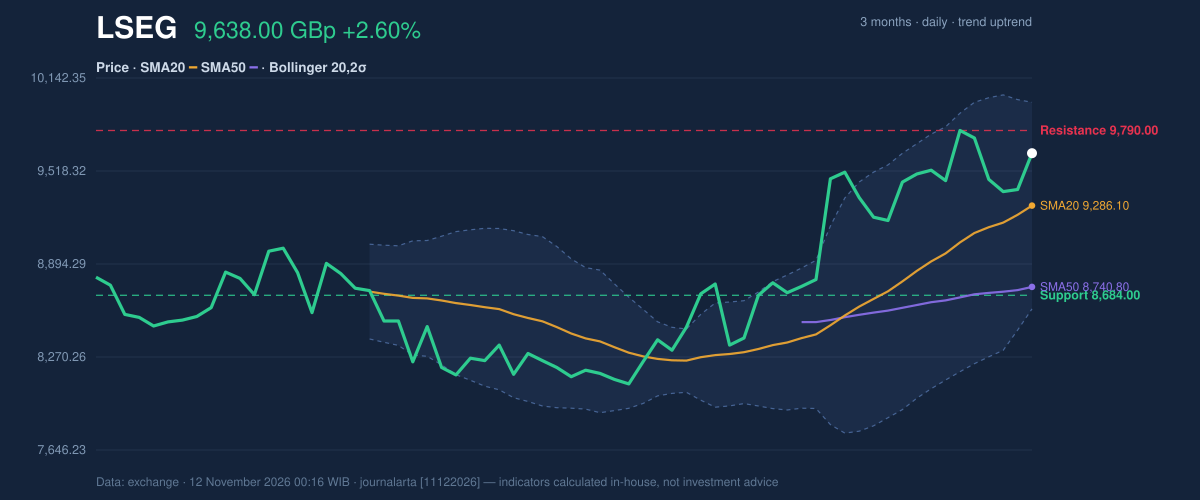
The structure is still constructive. The price sits above both the 20-day average at 9,286.10 and the 50-day average at 8,740.80, and the 20-day average is itself above the 50-day. The 20-day average rose 2.73% over five days, which describes the average's own slope and not the share price's gain. No new moving-average crossover has formed, so there is no fresh golden-cross or death-cross trigger. The uptrend is established, not newly signalled.
The latest session was a pullback toward the 20-day average within that uptrend, and the bounce from it is the first of two bullish signals in the data. As shown in the chart, price is now near the top of its recent range: 86% of the way between 20-day support at 8,684.00 and 20-day resistance at 9,790.00. The three-month high of 9,980.00 sits only a little above that resistance.
Oscillators & Momentum
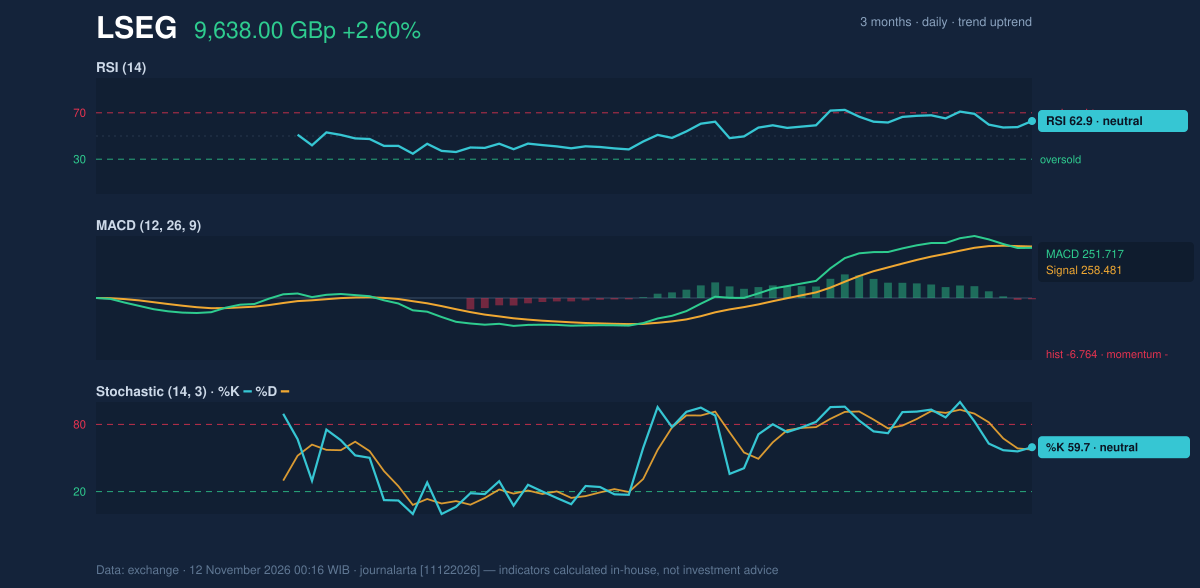
Momentum is where the picture gets less comfortable. The RSI(14) reads 62.9, neutral and inside the 50–70 zone. The relative strength index measures how strongly recent gains outweigh recent losses. Readings above 70 are usually called overbought, and this one has room before it gets there. But the data flags it as rolling over from above 65, a sign that buying pressure has already cooled from its recent peak.
The Stochastic oscillator is neutral, with %K at 59.7 and %D at 57.5. It compares the close with the recent trading range and offers no overbought or oversold warning. The MACD is less forgiving. The MACD line is at 251.717 against a signal line of 258.481, leaving a histogram of -6.764. That histogram has just turned negative, meaning short-term momentum has slipped below its own recent average even as the price stays above its longer averages. Such a gap often appears when a trend pauses to consolidate, though it can also precede a deeper pullback.
Volatility & Volume
The Bollinger Bands, which sit two standard deviations either side of the 20-day average, run from 8,592.79 to 9,979.41. The band width of 14.9% is normal, so the market is neither compressed ahead of a breakout nor stretched by a violent move. The %B reading of 75% puts the price in the upper part of the channel but not pressed against the upper band, which sits just under the three-month high.
The average true range of 259.50 is 2.7% of the price, a moderate daily swing. For context, 1.5 times that range gives 9,248.75 below the price and 10,027.25 above it.
Volume tempers the day's gain. Wednesday's turnover of 848,772 shares was 0.6 times the 20-day average of 1,389,184. A 2.60% rise on thin participation carries less conviction than the same move on heavy trading. On the other side, on-balance volume is rising. That indicator tallies volume on up days against down days, and it suggests that over the longer run money has been flowing in, not out.
Key Levels & Scenarios
The levels frame two conditional paths. A close above 9,790.00 would clear 20-day resistance and bring the three-month high of 9,980.00 into play. Beyond that sits the volatility-based marker of 10,027.25. A break below 8,684.00 would cost the stock its 20-day support. Further down, the lower Bollinger Band at 8,592.79 would come into view, then the three-month low of 8,012.00. Between those two lines, the evidence points both ways.
Technical Verdict: HOLD (wait & see)
JournalArta's research score is +50 on a scale of -100 to +100. A buy call needs +60 or above and a sell call -60 or below, so the stock lands on HOLD (wait & see). The reasons:
- Trend: price above the 50-day average, the 20-day above the 50-day, and an uptrend with rising OBV.
- Momentum: RSI rolling over from above 65 and a MACD histogram that has just turned negative, so trend and momentum are not yet aligned.
- Participation: Wednesday's volume was only 0.6 times normal, and the five-day change is negative.
The verdict would be invalidated if the price breaks below 20-day support at 8,684.00.
Conditional scenarios, drawn only from the reference levels:
- Upside scenario: entry zone on a close above 9,790.00; target 9,980.00 (three-month high), extended to 10,027.25; stop loss near 9,286.10 (20-day average).
- Downside scenario: triggered by a break below 8,684.00; target 8,012.00 (three-month low); stop loss near 9,286.10 (20-day average).
In plain terms: the longer-term picture for LSEG is healthy, but the short-term signals have not yet agreed on a direction, so the evidence supports waiting for a clear move beyond 9,790.00 or 8,684.00.
Summary Data LSEG
| Last price | 9,638.00 GBp |
| Change 1 day / 5 days / 1 month | 2.60% / -1.55% / 14.77% |
| Trend / MA-cross | uptrend / none |
| SMA20 / SMA50 | 9,286.10 / 8,740.80 |
| RSI (14) / Stochastic %K | 62.9 / 59.7 |
| Bollinger %B / ATR | 75% / 259.50 |
| Support / Resistance 20 days | 8,684.00 / 9,790.00 |
| Data as of | 12 November 2026 00:16 WIB |
| JournalArta research verdict (score) | Hold (+50) |
Today's full Buy and Sell list for UK, Singapore & Hong Kong stocks →
Disclaimer: This technical analysis is generated automatically from exchange data and indicators calculated by JournalArta, for information and education only. The verdict and the entry, target and stop-loss levels are not investment advice or a solicitation to buy or sell any security. Investment decisions and their risks rest solely with the reader.
Track LSEG share price daily: live levels, support/resistance and our full LSEG analysis history.