RELX Share Price on Wednesday: Rises 0.94%, Down 1.9% in Five Sessions
Technical analysis of RELX stock on November 11, 2026: price 3,000.00 GBp, trend uptrend, RSI 60.0, support 2,886.00, resistance 3,084.00.
RELX plc closed at 3,000.00 pence on the London Stock Exchange on Wednesday, November 11, 2026, up 0.94% on the day from a previous close of 2,972.00 pence. The data publisher's shares sit in an uptrend, but the picture is mixed: the stock is 1.90% lower over five days, even though it has gained 8.11% over one month. That gap is why it is on the watchlist today.
Two bullish signals and one bearish signal stand out. The shares pulled back to the 20-day average inside an uptrend, and rising on-balance volume supports that trend. Against that, the 14-day RSI is rolling over from above 65.
Trend & Price Action
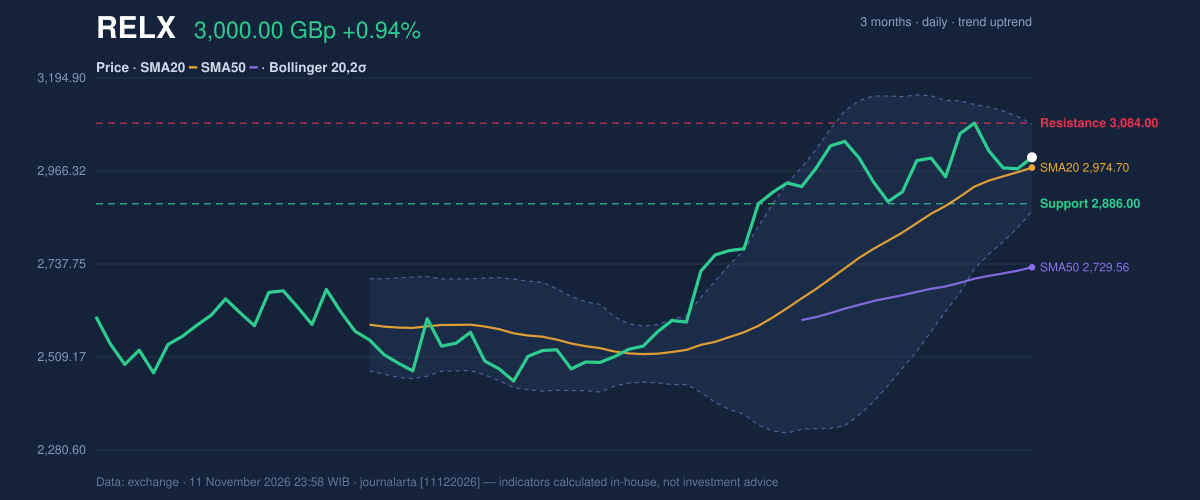
The structure is constructive. Price sits above both the 20-day simple moving average (SMA20) at 2,974.70 and the 50-day average (SMA50) at 2,729.56. A simple moving average is just the mean closing price over a set number of sessions. It smooths noise, so price holding above it is a basic sign of buyers in control.
The 20-day average itself rose 2.45% over five days, which shows the trend is still being fed by higher prices. DATA records no fresh moving-average crossover. The 20-day average already sits well above the 50-day, so the uptrend is established rather than newly formed.
The stock trades 58% of the way through its 20-day range, between support at 2,886.00 and resistance at 3,084.00. The three-month range runs from a low of 2,418.00 to a high of 3,129.00. At 3,000.00, RELX is about 4% below that peak. As the chart shows, price has been compressing between the Bollinger bands and the moving averages.
Oscillators & Momentum
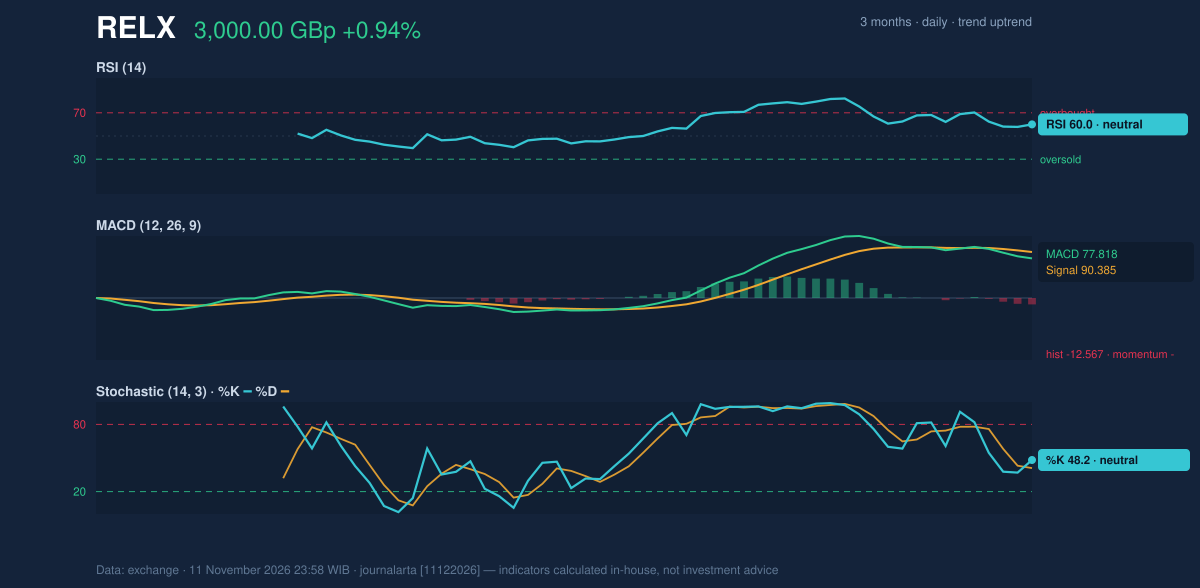
Momentum is less convincing than trend. The MACD line reads 77.818, below its signal line at 90.385, leaving a histogram of -12.567. MACD measures the gap between a fast and slow average of prices. When it sits under its signal line, short-term momentum is fading even if the longer trend is intact.
The RSI, a gauge of how strong recent gains are relative to losses on a 0 to 100 scale, stands at 60.0. That is neutral territory, not overbought. Stochastic %K is 48.2 and %D is 41.0, also neutral, with the faster line above the slower one.
The reading: the trend is up, but momentum has cooled from earlier in the month. Trend and momentum are not yet aligned, which limits conviction in either direction.
Volatility & Volume
Bollinger Bands, which draw a channel two standard deviations around the 20-day average, have narrowed to a width of 7.2%. Price sits at 62% of the band, between the upper band at 3,081.58 and the lower at 2,867.82. A squeeze like this often comes before a larger move, though it does not say which way. Average true range (ATR), a measure of typical daily movement, is 86.05 pence, or 2.9% of the price. That is moderate volatility.
Participation is healthy. Volume on the session was 4,776,770 shares, about 1.2 times the 20-day average of 4,148,263. On-balance volume, which adds volume on up days and subtracts it on down days, is rising. That supports the idea that the advance has real buying behind it.
Key Levels & Scenarios
The nearest resistance is 3,084.00, just under the upper Bollinger band. A close above it would open the way toward the three-month high of 3,129.00, a level that also sits close to the price plus 1.5 times ATR mark of 3,129.07. On the downside, support at 2,886.00 is the line to watch. A break below it would put the lower Bollinger band at 2,867.82 and the price minus 1.5 times ATR level of 2,870.93 in play.
Technical Verdict: HOLD (wait & see)
The JournalArta research score is +58 on a scale of -100 to +100, just short of the +60 needed for a buy rating. The call is HOLD (wait & see), for three reasons:
- Price is above the 50-day average and the 20-day average is above the 50-day, confirming an uptrend.
- MACD sits below its signal line with a negative histogram, so momentum does not yet match the trend.
- The RSI is rolling over from above 65, and the shares are down 1.90% over five days.
Conditional scenarios from the reference levels:
- Upside scenario: a close above 3,084.00 resistance, with an entry zone near 3,084.00, a target at 3,129.00 (the three-month high), and a protective stop near 2,974.70 (the SMA20).
- Downside scenario: a break below 2,886.00 support, with a target at 2,867.82 (lower Bollinger band) and a stop near 2,974.70.
The verdict is invalidated if price breaks below 2,886.00. In plain terms: RELX's trend is healthy, but the short-term push has stalled, so the data favours waiting for a clear break either way.
This is technical analysis based on market data, not an investment recommendation.
| Indicator | Value |
|---|---|
| Last price | 3,000.00 GBp |
| Change (1 day / 5 days / 1 month) | 0.94% / -1.90% / 8.11% |
| SMA20 / SMA50 | 2,974.70 / 2,729.56 |
| Bollinger (upper / middle / lower) | 3,081.58 / 2,974.70 / 2,867.82 |
| RSI(14) | 60.0 |
| Stochastic %K / %D | 48.2 / 41.0 |
| MACD / signal / histogram | 77.818 / 90.385 / -12.567 |
| ATR(14) | 86.05 |
| 20-day support / resistance | 2,886.00 / 3,084.00 |
| 3-month low / high | 2,418.00 / 3,129.00 |
Trading volume on November 11 was 4,776,770 shares.
Summary Data RELX
| Last price | 3,000.00 GBp |
| Change 1 day / 5 days / 1 month | 0.94% / -1.90% / 8.11% |
| Trend / MA-cross | uptrend / none |
| SMA20 / SMA50 | 2,974.70 / 2,729.56 |
| RSI (14) / Stochastic %K | 60.0 / 48.2 |
| Bollinger %B / ATR | 62% / 86.05 |
| Support / Resistance 20 days | 2,886.00 / 3,084.00 |
| Data as of | 11 November 2026 23:58 WIB |
| JournalArta research verdict (score) | Hold (+58) |
Today's full Buy and Sell list for UK, Singapore & Hong Kong stocks →
Disclaimer: This technical analysis is generated automatically from exchange data and indicators calculated by JournalArta, for information and education only. The verdict and the entry, target and stop-loss levels are not investment advice or a solicitation to buy or sell any security. Investment decisions and their risks rest solely with the reader.
Track RELX share price daily: live levels, support/resistance and our full RELX analysis history.