MetLife (MET) Stock Update: Rises 0.49%, Up 3.2% in a Month
Technical analysis of MET stock on November 11, 2026: price 102.94 USD, trend uptrend, RSI 58.2, support 98.27, resistance 103.57.
By Elena Vance
November 12, 20265 min read
Advertisement
MetLife (MET) Stock Update
Why MET is in focus today
Selected automatically from 7 NYSE (US) stocks by a technical-signal score with daily weighted randomisation — not a recommendation.
MetLife shares closed Wednesday at $102.94, up 0.49% on the day, and now sit at 88% of the Bollinger band range while that band narrows to its tightest in weeks. A 5-day change of just 0.05% against a 1-month gain of 3.23% describes a stock that climbed steadily and has spent the past week catching its breath. Three bullish technical signals and no bearish ones put MET on the JournalArta research list as a candidate worth watching.
Trend & Price Action
The trend is intact. Price sits above both the 20-day average at 100.82 and the 50-day average at 98.56, and the shorter average is above the longer one. That arrangement is the textbook signature of an uptrend: recent buyers are paying more than those of the past two months. There is no new moving-average crossover, so the structure is a mature trend rather than a fresh turn. The 20-day average rose 0.38% over five days, a gentle slope that points to a measured climb rather than a surge.
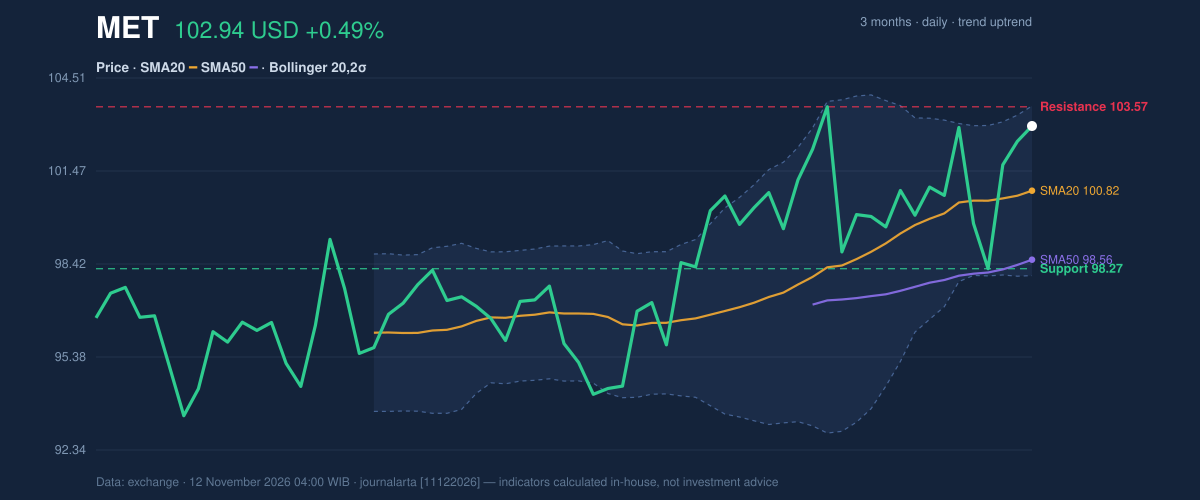
As shown in the chart below, price has pulled back toward the 20-day average within this uptrend, one of the three signals flagged by the screening code. Pullbacks to a rising average are where trend-followers watch most closely, because holding that line suggests the earlier advance has not been abandoned.
3-month price action chart of MET: price, SMA20/50, Bollinger, support & resistance.
Advertisement
The 20-day range runs from support at 98.27 to resistance at 103.57, and the last price is only about 0.6 below the top of it. The three-month range is wider, from a low of 92.21 to a high of 106.72, which leaves room above the current level before the stock tests its recent peak.
Oscillators & Momentum
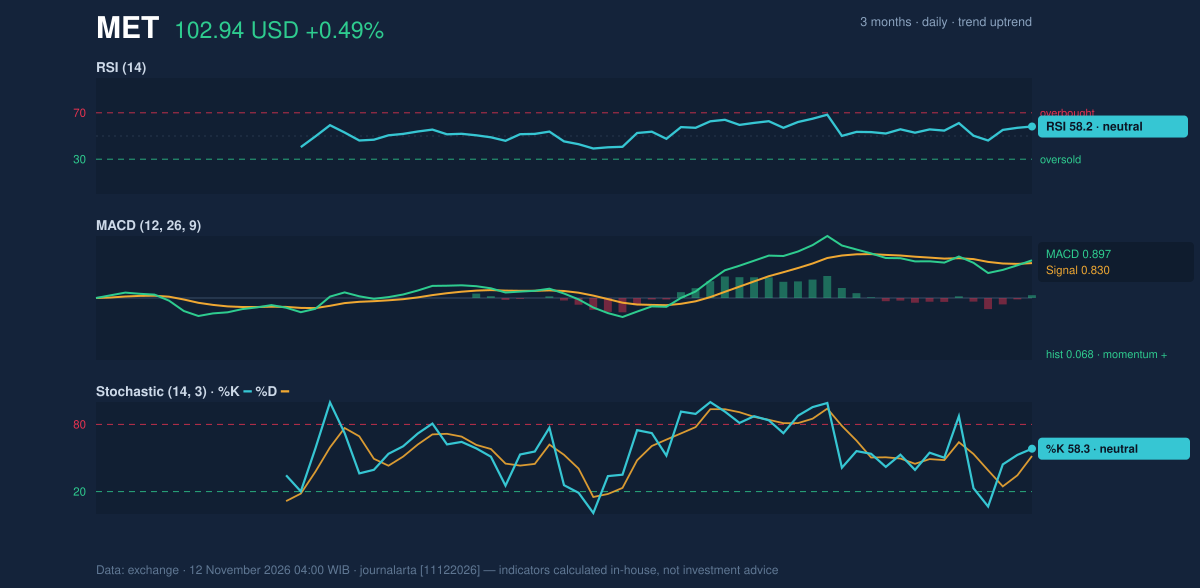
Momentum is positive but unstretched. The RSI(14) reads 58.2, neutral and well below the 70 level that usually marks overbought conditions. The Stochastic oscillator shows %K at 58.3 against %D at 51.8, also neutral, with the faster line above the slower one, a mild sign of improving short-term momentum.
The MACD line stands at 0.897 against a signal line of 0.830, a histogram of 0.068. The histogram has just turned positive, the second of the three signals. In plain terms, the gap between the fast and slow trend measures has begun widening in the bullish direction. The reading is small, so it signals a change in direction rather than strong force.
Momentum chart of MET: RSI(14), MACD, Stochastic.
Advertisement
Volatility & Volume
The Bollinger bands (20 days, 2 standard deviations) span 98.05 to 103.60, and their width has shrunk to 5.5% of price. Narrowing bands, known as a squeeze, mean recent price swings have been unusually small, and such quiet stretches often precede a larger move. The squeeze does not indicate direction. With %B at 88%, price is near the upper band, which tilts the odds of any resolution toward the upside but also means the stock is already leaning on a ceiling.
The ATR(14) of 2.75, or 2.7% of the price, is moderate volatility, so a typical daily swing is not extreme. Wednesday's volume of 3,036,000 was about 0.9 times the 20-day average of 3,246,350, slightly light. A move toward resistance on below-average volume lacks strong conviction. Even so, on-balance volume (OBV), a running tally of volume on up days minus down days, is rising, the third bullish signal. That suggests buying pressure has been building underneath the quiet price action.
Fundamental Context
According to its SEC filing (Form 10-Q, filed 6 November 2026), MetLife reported quarterly revenue of $728.0 million for the quarter ended 30 September, up 17.2% from $621.0 million a year earlier. Net income was $2.40 billion, against $896.0 million a year earlier, with diluted earnings per share of $3.67. The company also filed a Form 8-K on 10 November reporting a material definitive agreement; the filing summary does not detail its terms. A separate 8-K on 4 November covered results of operations and financial condition. Earnings strength offers background to the technical picture, though the verdict below rests on the price signals.
Advertisement
Key Levels & Scenarios
The nearest ceiling is 20-day resistance at 103.57, just above the Bollinger upper band at 103.60. A close through that zone would mean the squeeze has resolved upward and would put the three-month high of 106.72 in view. If price instead fails to hold the 20-day average near 100.82, the next marker is support at 98.27, close to the lower band at 98.05.
Technical Verdict: BUY
The JournalArta research score is +84 on a scale running from −100 to +100, where +60 or above qualifies as BUY. The verdict is BUY, supported by:
- Trend: price above the 50-day average, the 20-day above the 50-day, and an uptrend in place.
- Momentum: the MACD histogram has just turned positive, at 0.068.
- Participation: OBV is rising, confirming the move despite lighter volume.
Levels computed by the research code, valid until 10 December 2026:
- Entry range: 100.88 – 102.94
- Exit target 1: 110.77 (reward/risk 1.5)
- Exit target 2: 118.60 (reward/risk 3.0)
- Stop loss: 97.72
The verdict is invalidated if price breaks below the 97.72 stop level. Risks include the squeeze breaking downward and the thin volume, which tempers conviction near resistance.
In plain terms: the data favor MetLife's rising trend continuing, provided it holds above roughly 97.72. This is technical analysis, not an investment recommendation.
Next on the calendar is the validity window of these levels, which runs to 10 December 2026.
| Indicator | Reading |
|---|---|
| Last price (11 Nov 2026) | $102.94 |
| Change: 1 day / 5 days / 1 month | 0.49% / 0.05% / 3.23% |
| SMA20 / SMA50 | 100.82 / 98.56 |
| Bollinger upper / middle / lower | 103.60 / 100.82 / 98.05 |
| RSI(14) | 58.2 |
| Stochastic %K / %D | 58.3 / 51.8 |
| MACD / signal / histogram | 0.897 / 0.830 / 0.068 |
| ATR(14) | 2.75 |
| Support / resistance (20 days) | 98.27 / 103.57 |
| 3-month high / low | 106.72 / 92.21 |
Disclaimer: This technical analysis is generated automatically from exchange data and indicators calculated by JournalArta, for information and education only. The verdict and the entry, target and stop-loss levels are not investment advice or a solicitation to buy or sell any security. Investment decisions and their risks rest solely with the reader.