RTX Stock Update: Rises 0.51%, Up 1.4% in Five Sessions
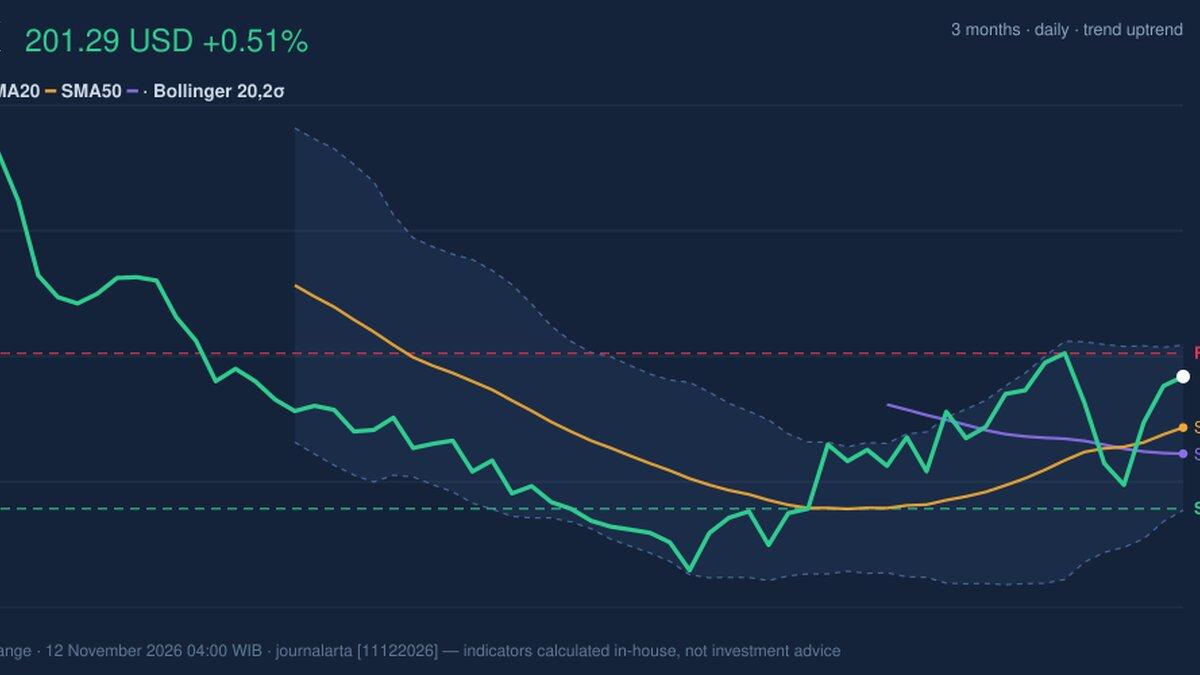
Technical analysis of RTX stock on November 11, 2026: price 201.29 USD, trend uptrend, RSI 57.4, support 186.95, resistance 203.82.
Why RTX is in focus today
Selected automatically from 7 NYSE (US) stocks by a technical-signal score with daily weighted randomisation — not a recommendation.
Trend & Price Action
The 20-day simple moving average (SMA20) stands at $195.75 and the 50-day (SMA50) at $192.92. The gap between them is under three dollars, so the cross is recent and the lines have not yet pulled far apart. The 20-day average rose 1.37% over five days, a measure of how quickly the recent price base is lifting. It is the average's slope, not the stock's own gain.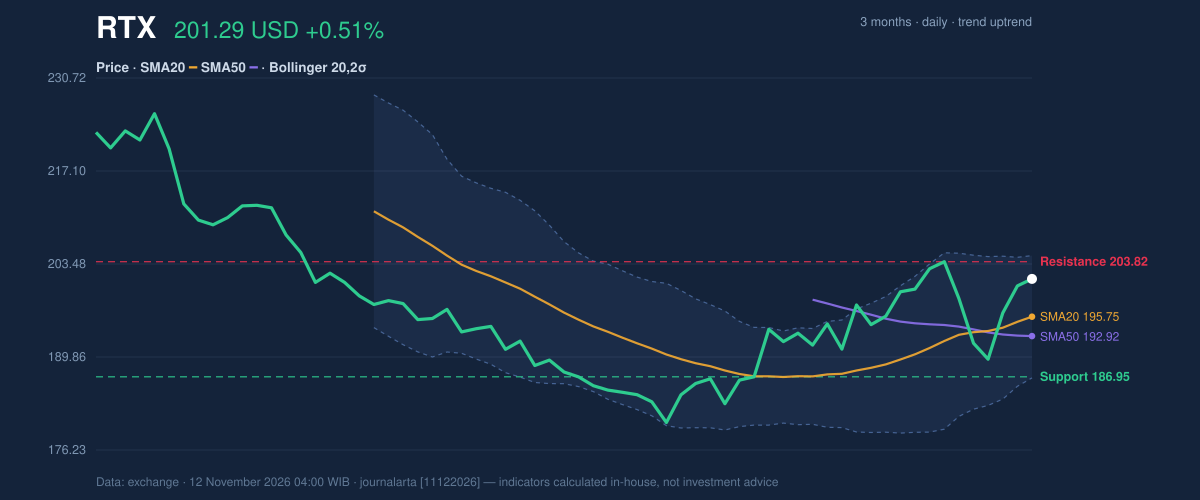
Oscillators & Momentum
Momentum indicators give a measured reading rather than an excited one. The 14-day Relative Strength Index (RSI), which scores the pace of recent gains against losses on a 0–100 scale, is 57.4, classed as neutral. Readings above 70 are conventionally seen as stretched; this one has room to run before it signals that. The Stochastic oscillator, which shows where the close sits within its recent high-low range, reads %K 75.8 against %D 64.7. Also neutral, but with the faster line above the slower one, it suggests short-term buying pressure has been building.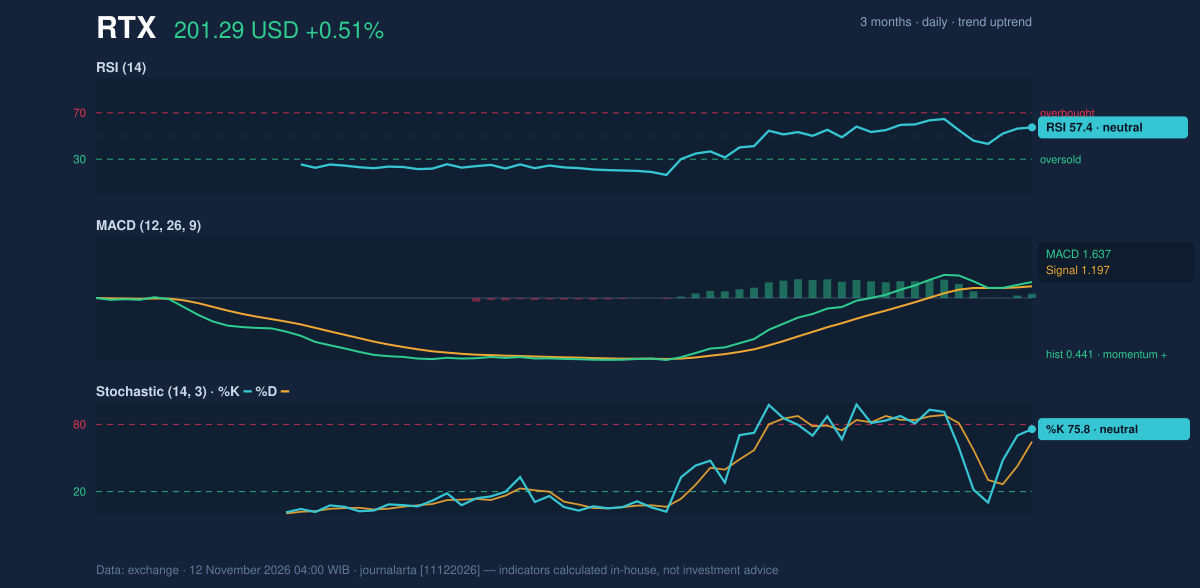
Volatility & Volume
Bollinger Bands, which draw a channel two standard deviations around the 20-day average, span $186.79 to $204.72. Price sits at a %B of 81%, meaning it is in the upper fifth of the channel. Band width of 9.2% is classed as normal, so there is no squeeze signaling an imminent burst and no wide expansion signaling a stretched move. The 14-day Average True Range (ATR) of $5.76, or 2.9% of the price, points to moderate daily swings. Participation is the softer point. Wednesday's volume of 4,456,600 shares was 0.7 times the 20-day average of 6,074,335. A rise on below-average turnover is less convincing than one on heavy trading. Against that, On-Balance Volume (OBV), a running tally that adds volume on up days and subtracts it on down days, is rising, which indicates that over the longer window buying volume has outweighed selling.Fundamental Context
According to its Form 10-Q filed with the SEC on October 20, RTX reported quarterly revenue of $24.97 billion for the quarter ended September 30, up 11.1% from $22.48 billion a year earlier. Net income was $2.58 billion, against $1.92 billion in the same quarter a year ago, and diluted earnings per share came to $1.89. Rising sales and profit give the technical improvement some earnings backing, though the verdict below rests on the chart signals.Key Levels & Scenarios
Resistance at $203.82 sits just above the close and lines up with the upper Bollinger Band at $204.72. A sustained move through that zone would open the way toward the levels in the verdict. A failure to hold the SMA20 near $195.75 would point back toward the $186.95 support, where the lower Bollinger Band at $186.79 also sits.Technical Verdict: BUY
JournalArta's research model rates RTX BUY with a score of +84 on a scale running from −100 to +100, where +60 or above qualifies as a buy. Three reasons stand out: - The golden cross of SMA20 over SMA50 is fresh, with price above both averages. - MACD sits above its signal line with a positive histogram of 0.441. - OBV is rising, confirming the uptrend with volume. The levels, valid until December 10, 2026: - Entry range: $196.98 – $201.29 - Exit target 1: $215.97 (reward/risk 1.5) - Exit target 2: $230.66 (reward/risk 3.0) - Stop loss: $191.50 The verdict is invalidated if the price falls below $191.50. The main caution is volume at 0.7 times average, which leaves the advance less proven. In plain terms, the chart is leaning upward for RTX, but the move needs stronger trading volume to prove it. This is technical analysis, not an investment recommendation.Summary Data RTX
| Last price | 201.29 USD |
| Change 1 day / 5 days / 1 month | 0.51% / 1.44% / 7.95% |
| Trend / MA-cross | uptrend / golden |
| SMA20 / SMA50 | 195.75 / 192.92 |
| RSI (14) / Stochastic %K | 57.4 / 75.8 |
| Bollinger %B / ATR | 81% / 5.76 |
| Support / Resistance 20 days | 186.95 / 203.82 |
| Data as of | 12 November 2026 04:00 WIB |
| JournalArta research verdict (score) | Buy (+84) |
| Entry zone | 196.98 – 201.29 |
| Target 1 / 2 | 215.97 / 230.66 |
| Stop loss | 191.50 |
| Reward/risk | 1.5 / 3.0 |
Today's full Buy and Sell list for US stocks →
Disclaimer: This technical analysis is generated automatically from exchange data and indicators calculated by JournalArta, for information and education only. The verdict and the entry, target and stop-loss levels are not investment advice or a solicitation to buy or sell any security. Investment decisions and their risks rest solely with the reader.
Track RTX stock price daily: live levels, support/resistance and our full RTX analysis history.