Pfizer (PFE) Stock Update: Rises 0.31%, Down 4.4% in Five Sessions
Technical analysis of PFE stock on November 11, 2026: price 29.45 USD, trend sideways, RSI 50.4, support 29.23, resistance 30.79.
By matthew jonathan
November 12, 20265 min read
Advertisement
Logo Pfizer — JournalArta illustration
Pfizer (PFE) closed Wednesday's session on November 11, 2026 at $29.45, up 0.31% on the day from a $29.36 prior close. That small gain follows a 4.35% decline over five days, and it leaves the stock sitting below its 20-day average of $29.86 while still above the 50-day at $28.80. JournalArta has not covered the name in the past 14 days, and the setup now is a stock caught between two averages, with volatility compressing and momentum fading.
Trend & Price Action
Over one month, PFE is up 0.82%, which is close to flat and fits the sideways trend reading. The 20-day average rose 0.88% over five days, so the underlying drift is gently upward even though the price has slipped beneath that line. No new moving-average cross has formed. The 20-day average remains above the 50-day, which keeps the medium-term structure intact: the recent pullback has not broken the longer slope.
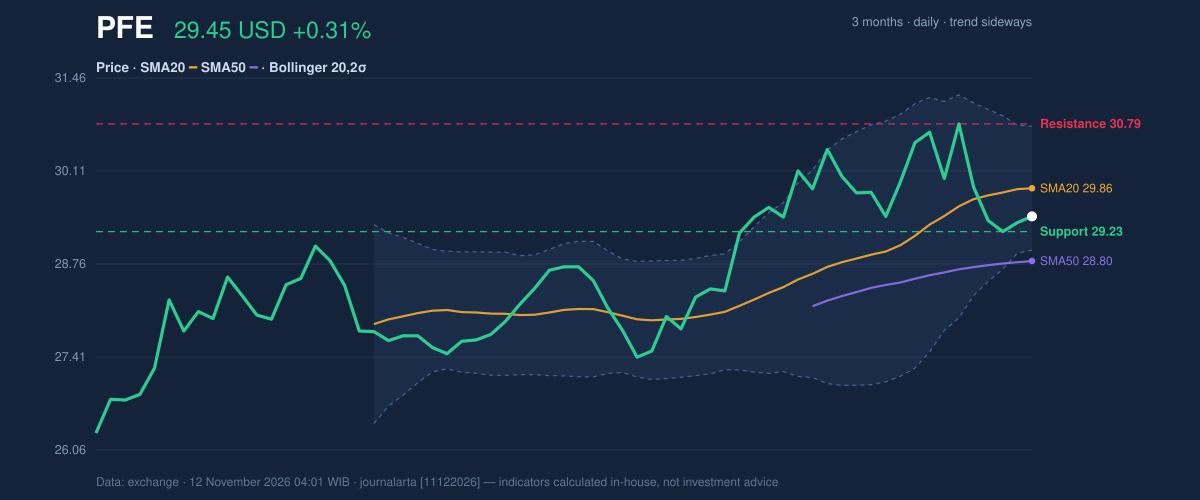
The stock trades at 14% of its 20-day range, close to the bottom. The 20-day support sits at $29.23, only 22 cents below the last price, while resistance is at $30.79. The three-month range runs from $26.18 to $31.44, so Pfizer is currently in the lower half of its quarterly band. As the chart shows, the price has slid from the upper Bollinger region toward the lower one.
3-month price action chart of PFE: price, SMA20/50, Bollinger, support & resistance.
Advertisement
One technical signal fires on the bullish side: a pullback to the 20-day average within an uptrend, defined as price above the 50-day. No bearish signals trigger. In plain terms, the dip looks like a test of the short-term trend, not a reversal of it, though a test can still fail.
Oscillators & Momentum
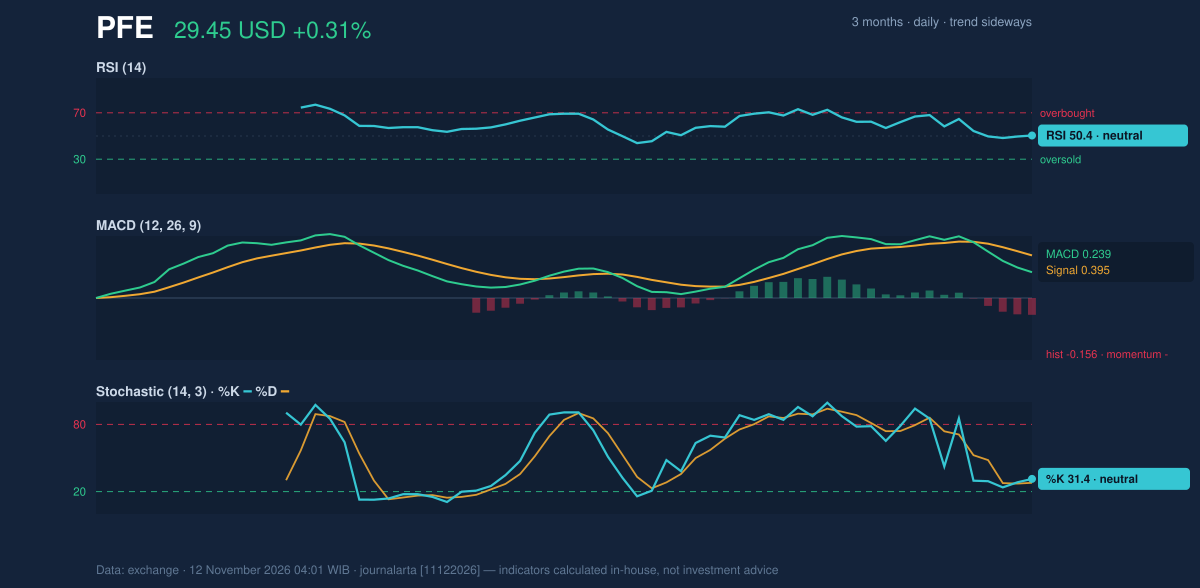
Momentum is where the picture turns mixed. RSI (14) reads 50.4, dead neutral, meaning recent gains and losses are balanced. The Stochastic oscillator is at 31.4 (%K) and 27.8 (%D), also neutral but leaning toward the lower end, which reflects the five-day slide.
The sharper signal is the MACD. The line sits at 0.239 against a signal line at 0.395, leaving a histogram of -0.156. A negative histogram means short-term momentum is weaker than its own recent average. The MACD line remains positive, so the longer-run trend still leans up, but the crossover below the signal line says buyers have lost pace. Price and momentum are not aligned yet.
Momentum chart of PFE: RSI(14), MACD, Stochastic.
Volatility & Volume
Bollinger Bands (20 days, 2 standard deviations) span $28.96 to $30.76, with the middle band at $29.86. Band width has narrowed to 6.0%, a squeeze. Squeezes describe compressed volatility and often precede larger moves, but they do not indicate direction. The %B reading of 27% puts the price in the lower part of the band, closer to $28.96 than to $30.76.
The Average True Range (ATR), a measure of typical daily movement, is $0.79, or 2.7% of the price, a moderate level. Using 1.5 times ATR, the downside reference is $28.26 and the upside reference is $30.64.
Volume was 25,977,300 shares, only 0.7 times the 20-day average of 35,672,590. Thin participation weakens the message of any single day's move. On-balance volume (OBV), which tracks cumulative buying versus selling pressure, is rising. That suggests volume has been heavier on up days than down days despite the price drop, a quiet point in favor of the trend.
Advertisement
Key Levels & Scenarios
The range between $29.23 and $30.79 defines the near-term map. A close above the 20-day resistance at $30.79 would clear the top of the squeeze and bring the 3-month high of $31.44 into view. A break below the 20-day support at $29.23 would put the lower Bollinger band at $28.96 and the 50-day average at $28.80 in play, with the 1.5×ATR reference at $28.26 beyond that.
Fundamental Context
According to its SEC filing (Form 10-Q, filed November 3, 2026), Pfizer reported quarterly revenue of $16.58 billion for the quarter ended September 27, down 0.4% from $16.65 billion a year earlier. Net income was $3.24 billion versus $3.54 billion a year before, with diluted earnings per share of $0.56. The company also filed two Form 8-Ks the same day, one covering results of operations and financial condition, and one reporting a change of directors or officers. Flat revenue and lower profit are consistent with a stock that has struggled to build momentum.
Technical Verdict: HOLD (wait & see)
JournalArta's research score for PFE is +48 on a scale running from -100 to +100, short of the +60 needed for a buy reading and far from the -60 sell threshold. The call is HOLD (wait & see).
Strongest reasons:
- Trend and momentum disagree: the 20-day average is above the 50-day, but the MACD histogram is negative at -0.156 and price is below the 20-day average.
- Neutral oscillators: RSI at 50.4 and Stochastic at 31.4/27.8 give no strong directional edge.
- Squeeze without direction: Bollinger width of 6.0% signals a coming move, but volume at 0.7 times normal does not yet confirm one.
Conditional scenarios from the reference levels:
- Upside scenario: entry range on a close above $30.79; exit target near $31.44 (3-month high); stop loss near $30.64 (price + 1.5×ATR reference) only if the breakout fails to hold.
- Downside scenario: triggered if price breaks $29.23; reference exit zone $28.26 (price − 1.5×ATR); protective level above at $29.86 (20-day average).
The verdict is invalidated if price breaks below the 3-month low of $26.18 or closes above $31.44 with rising volume. This is technical analysis, not an investment recommendation.
In plain terms: Pfizer is drifting in a narrow range with no clear winner between buyers and sellers, so the chart says to watch for a break in either direction before drawing conclusions.
| Metric | Value |
|---|---|
| Last price (Nov 11, 2026) | $29.45 |
| 1-day / 5-day / 1-month change | 0.31% / -4.35% / 0.82% |
| SMA20 / SMA50 | $29.86 / $28.80 |
| Bollinger (upper / middle / lower) | $30.76 / $29.86 / $28.96 |
| RSI(14) | 50.4 |
| Stochastic %K / %D | 31.4 / 27.8 |
| MACD / signal / histogram | 0.239 / 0.395 / -0.156 |
| ATR(14) | $0.79 (2.7%) |
| 20-day support / resistance | $29.23 / $30.79 |
| 3-month low / high | $26.18 / $31.44 |
| Volume vs 20-day average | 0.7× |
Disclaimer: This technical analysis is generated automatically from exchange data and indicators calculated by JournalArta, for information and education only. The verdict and the entry, target and stop-loss levels are not investment advice or a solicitation to buy or sell any security. Investment decisions and their risks rest solely with the reader.