Constellation Energy (CEG) Stock Latest: Climbs 2.60% on Wednesday, Up 11.8% in Five Sessions
Technical analysis of CEG stock on November 11, 2026: price 274.73 USD, trend sideways, RSI 54.6, support 239.65, resistance 276.09.
Constellation Energy ended Wednesday's session on November 11 at $274.73, up 2.60% on the day and 11.81% over five days, yet still 1.72% lower over one month. The stock now sits just under the top of its 20-day range, a level that has capped the rally so far.
Why CEG is in focus today
- One-day move of 0.00%, about 0.0× its average daily range (ATR)
Selected automatically from 11 NASDAQ (US) stocks by a technical-signal score with daily weighted randomisation — not a recommendation.
Trend & Price Action
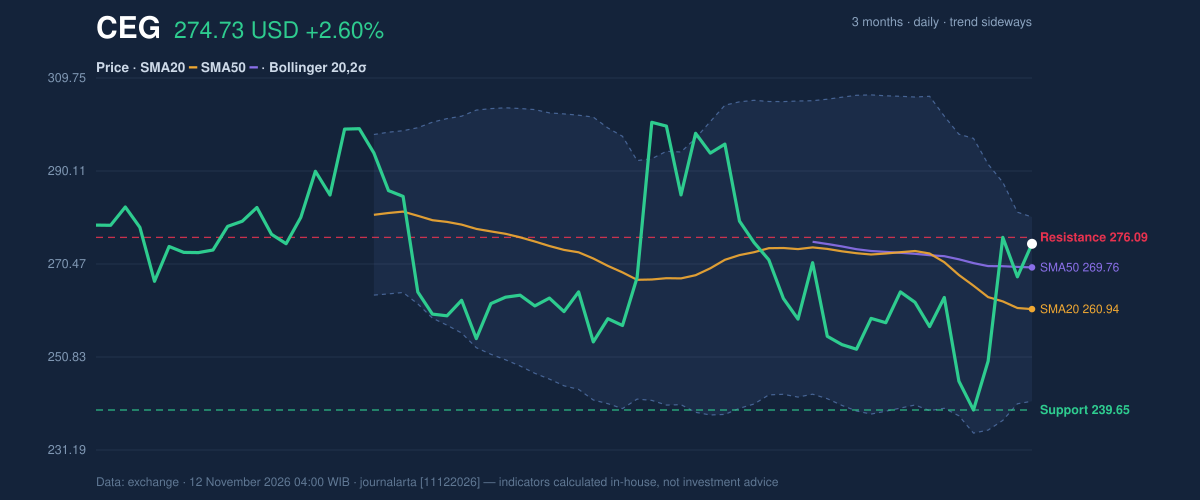
The shares closed above the 20-day average of $260.94 but below the 50-day average of $269.76 at the top of that range. The 20-day average itself fell 2.69% over five days. That means this week's jump is a rebound inside a broader sideways pattern, not a confirmed change of direction. No new moving-average crossover has formed, and the 20-day line remains under the 50-day line.
As the chart shows, the price has pushed to 96% of its 20-day range, between support at $239.65 and resistance at $276.09. Only $1.36 separates the last close from that ceiling. For context, the three-month high is $309.80 and the low is $231.30, so the stock trades well below the top of its recent range despite the bounce.
Oscillators & Momentum
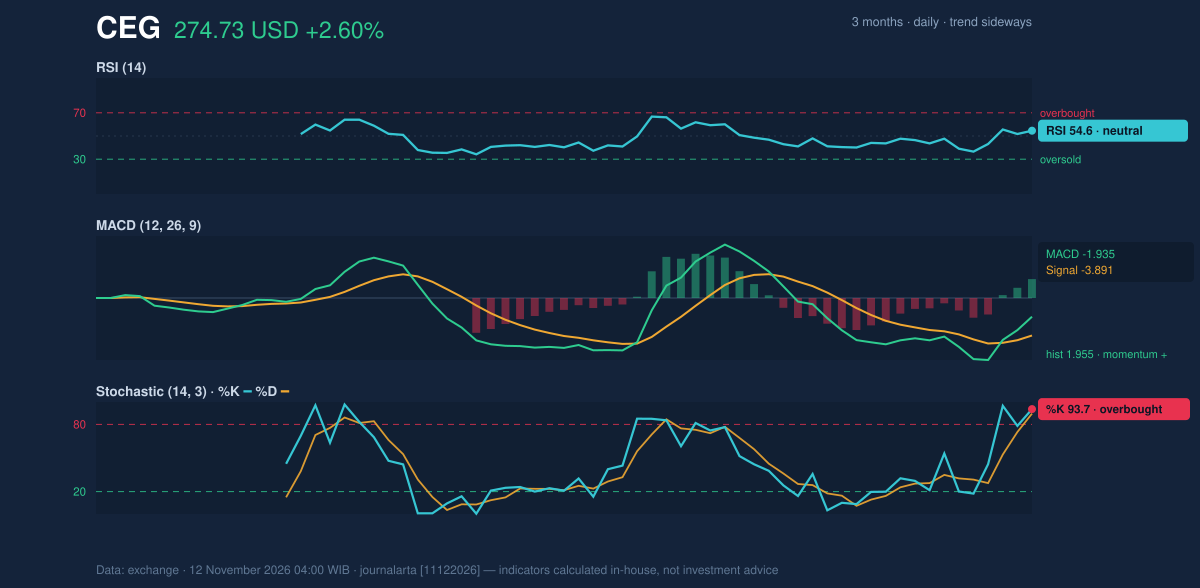
Momentum indicators give mixed readings. The 14-day Relative Strength Index (RSI), which measures the speed of recent gains against losses, stands at 54.6, neutral. It signals neither exhaustion nor strong buying pressure. The Stochastic oscillator, which compares the close with the recent trading range, is more stretched: %K at 93.7 and %D at 89.6 both sit in overbought territory. After a five-day climb of nearly 12%, that suggests the bounce may need to pause.
The MACD (moving average convergence divergence) line is at -1.935, still below its signal line at -3.891. Its histogram, the gap between the two, has turned positive at 1.955, the only bullish technical signal the code flagged. Put simply, downward momentum is fading, but the MACD has not yet crossed above zero, so the turn is early and unconfirmed.
Volatility & Volume
Price sits at 85% of the Bollinger Band range, which is built from a 20-day average plus and minus two standard deviations. The upper band is $280.39, the middle $260.94 and the lower $241.49. Band width of 14.9% is normal, so the market is not in a squeeze. The Average True Range (ATR), a gauge of typical daily movement, is 13.01, or 4.7% of the price. That is high, and it means a single session can easily swing the stock by double-digit dollars.
Participation is a weak point in the rally. Wednesday's volume of 3,024,000 shares was about 0.8 times the 20-day average of 3,963,100. On-balance volume (OBV), which tracks whether volume is flowing into or out of a stock, is falling. A price rise on lighter-than-usual trading, with OBV moving the other way, suggests buyers have not yet committed in force.
Fundamental Context
According to its SEC filing, Constellation Energy reported quarterly revenue of $5.84 billion for the quarter ended June 30, up 13.2% from $5.16 billion a year earlier (Form 10-Q filed August 6). Net income was $513.0 million, down from $839.0 million a year earlier, with diluted earnings per share of $1.42. Revenue growth alongside lower profit means the top line is not translating into earnings at last year's rate. On November 9, the company filed a Form 8-K with the U.S. Securities and Exchange Commission reporting its results of operations and financial condition, along with a Regulation FD disclosure.
Technical Verdict: HOLD (wait & see)
The JournalArta research score is +28 on a scale of -100 to +100, well short of the +60 level needed for a positive call. Three points drive the HOLD (wait & see) reading:
- Trend and momentum are not aligned: the price is above the 20-day average, but the 20-day average is still below the 50-day.
- Stochastic is overbought at 93.7 while OBV is falling, so the rebound lacks volume support.
- The MACD histogram has just turned positive, but the MACD line remains below its signal line, so confirmation is missing.
The levels below are conditional scenarios drawn from the reference levels, not recommendations:
- Upside scenario: a close above the 20-day resistance at $276.09 would open the way toward the upper Bollinger Band at $280.39, then $294.25 (price plus 1.5 times ATR). Falling back below the 20-day average at $260.94 would undermine that setup.
- Downside scenario: a break of the 20-day support at $239.65 would shift attention to the three-month low of $231.30. The level at $255.21 (price minus 1.5 times ATR) marks an earlier warning zone.
The HOLD verdict is invalidated if the price closes decisively above $276.09 on rising volume, or breaks below $239.65.
In plain terms, the stock has bounced sharply but has not yet proved the move can last, so the data favors waiting for a clearer signal.
Summary Data CEG
| Last price | 274.73 USD |
| Change 1 day / 5 days / 1 month | 2.60% / 11.81% / -1.72% |
| Trend / MA-cross | sideways / none |
| SMA20 / SMA50 | 260.94 / 269.76 |
| RSI (14) / Stochastic %K | 54.6 / 93.7 |
| Bollinger %B / ATR | 85% / 13.01 |
| Support / Resistance 20 days | 239.65 / 276.09 |
| Data as of | 12 November 2026 04:00 WIB |
| JournalArta research verdict (score) | Hold (+28) |
Today's full Buy and Sell list for US stocks →
Disclaimer: This technical analysis is generated automatically from exchange data and indicators calculated by JournalArta, for information and education only. The verdict and the entry, target and stop-loss levels are not investment advice or a solicitation to buy or sell any security. Investment decisions and their risks rest solely with the reader.
Track CEG stock price daily: live levels, support/resistance and our full CEG analysis history.