Tesla (TSLA) Stock Climbs 2.91% on Wednesday, Up 1.5% in Five Sessions
Technical analysis of TSLA stock on November 11, 2026: price 390.84 USD, trend sideways, RSI 54.5, support 343.69, resistance 407.46.

Why TSLA is in focus today
- One-day move of 0.00%, about 0.0× its average daily range (ATR)
Selected automatically from 11 NASDAQ (US) stocks by a technical-signal score with daily weighted randomisation — not a recommendation.
Trend & Price Action
Tesla's trend reads as sideways despite the rebound. The price sits above the 20-day simple moving average (SMA20) at 381.83 and the 50-day average (SMA50) at 373.65. A moving average is simply the mean closing price over a set number of sessions, and it helps show whether buyers or sellers have held the upper hand. Here the shorter average sits above the longer one, which is a constructive arrangement, but there is no new MA-cross, so no fresh trend signal has been triggered. The slope tells the more cautious half of the story. The 20-day average slipped 0.36% over five days. That is the movement of the average itself, not of the share price, and it shows that the recent closes are only now catching up with the prior month's levels. Price is climbing back toward an average that has been drifting lower. As shown in the chart below, the shares are trading in the upper half of their 20-day range, at about 74% of the distance between support at 343.69 and resistance at 407.46. The three-month range runs from 323.64 to 414.23, so Tesla remains within roughly 6% of its three-month high but has not tested it.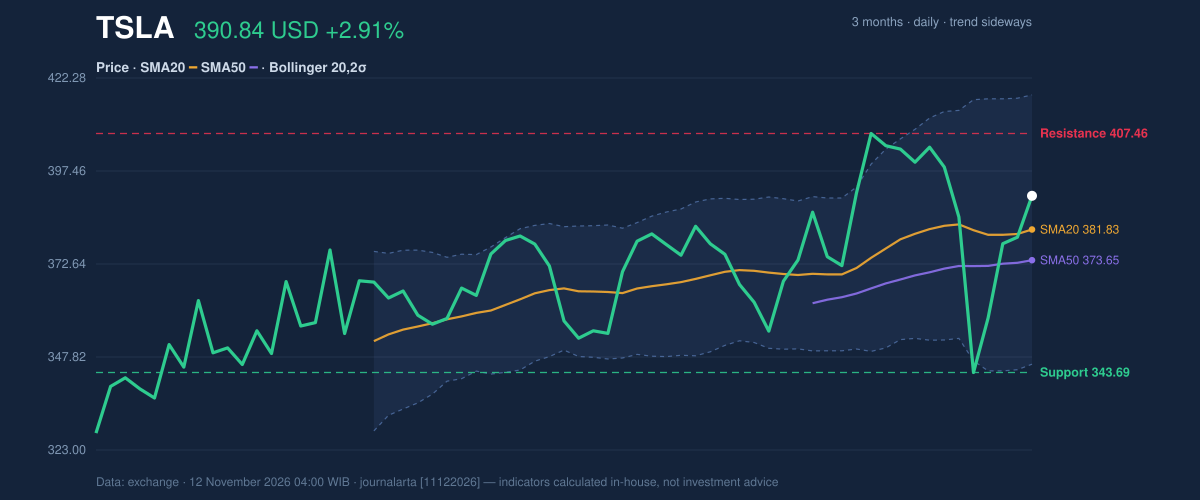
Oscillators & Momentum
The relative strength index (RSI), which gauges the speed of recent price changes on a 0-100 scale, stands at 54.5. That is neutral: neither overbought (typically above 70) nor oversold (below 30). The Stochastic oscillator, which compares the close with the recent trading range, shows %K at 69.3 and %D at 58.8. %K is above %D, indicating short-term upward pressure, but it is still short of the overheated zone. The MACD is where the picture softens. The line stands at 2.053 against a signal line of 3.811, leaving a histogram of -1.758. A negative histogram means short-term momentum is running below its own recent average. In plain terms, the bounce has not yet produced the acceleration that usually accompanies a durable upswing. Price strength alongside fading MACD momentum is a classic mismatch, and it is the main reason the trend and momentum readings are not aligned.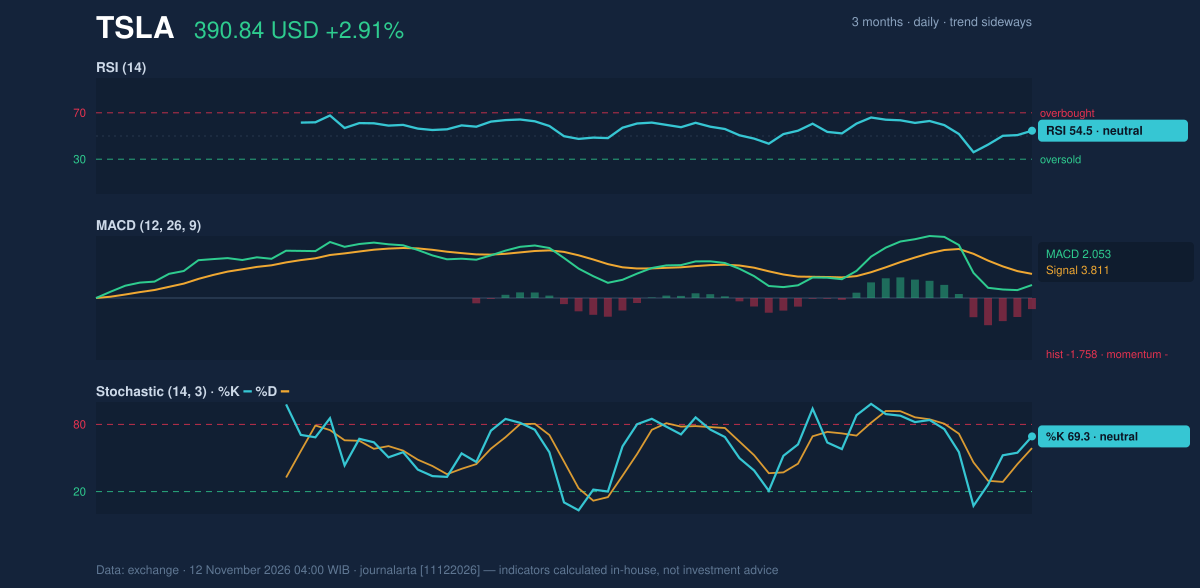
Volatility & Volume
The Bollinger Bands, which draw a channel two standard deviations around the 20-day average, span 345.90 to 417.77. The price sits at a %B reading of 63%, meaning it is a little over halfway up the band. Band width is 18.8%, described as normal, so there is no squeeze pointing to an imminent breakout. Volatility itself is not low. The 14-day average true range (ATR), a measure of the typical daily swing, is 18.34, or 4.7% of the share price. A stock moving nearly 5% in an ordinary session can reverse gains quickly, which makes the day's 2.91% advance unremarkable by Tesla's own standards. Participation is the weak link. Volume of 27.7 million shares was only 0.7 times the 20-day average of 40.8 million, and on-balance volume (OBV), which accumulates volume on up days and subtracts it on down days, is falling. A rally on below-average turnover and declining OBV suggests that fewer buyers are driving the advance than the price alone implies.Fundamental Context
According to its SEC filing (Form 10-Q, filed October 22, 2026), Tesla reported quarterly revenue of $28.05 billion for the quarter ended September 30, down 0.2% from $28.10 billion a year earlier. Net income was $787.0 million, compared with $1.37 billion a year earlier, and diluted earnings per share were $0.22. Flat sales and lower profit help explain why the stock has struggled to build a clear trend even after a one-month gain.Key Levels & Scenarios
Resistance at 407.46 is the first hurdle, with the three-month high of 414.23 just above it. Support at 343.69 anchors the downside, followed by the three-month low of 323.64. Adding and subtracting 1.5 times the ATR from the last price gives a volatility-based band of 363.33 to 418.35.Technical Verdict: HOLD (wait & see)
JournalArta's research model scores Tesla at +50 on a scale of -100 to +100, short of the +60 needed for a buy call and well above the -60 sell threshold. The call is HOLD (wait & see). The strongest reasons: - Trend and momentum disagree: price is above SMA20 and SMA50, but the MACD histogram is negative at -1.758. - Weak participation: volume was 0.7 times its 20-day average and OBV is falling. - No fresh signal: there is no new MA-cross, RSI is neutral at 54.5, and the 20-day average is still sloping down. Conditional scenarios, drawn only from the reference levels: - Upside scenario: a close above the 20-day resistance at 407.46 would be the entry trigger, with the three-month high at 414.23 and the upper volatility level at 418.35 as exit targets. - Downside scenario: a break of the 20-day support at 343.69 would shift the bias lower, with the three-month low at 323.64 as the next reference. - Stop-loss reference: the volatility level of 363.33 (price minus 1.5 times the ATR) marks where the current rebound structure would be in question. The verdict is invalidated if the price falls below 343.69 or closes above 407.46 on rising volume. In plain terms: Tesla has bounced, but the move lacks conviction, so the data favors waiting for a clearer break in either direction. This is technical analysis, not an investment recommendation. | Indicator | Value | |---|---| | Last price | 390.84 USD | | 1-day / 5-day / 1-month change | 2.91% / 1.47% / 6.45% | | SMA20 / SMA50 | 381.83 / 373.65 | | RSI(14) | 54.5 | | Stochastic %K / %D | 69.3 / 58.8 | | MACD / signal / histogram | 2.053 / 3.811 / -1.758 | | Bollinger upper / middle / lower | 417.77 / 381.83 / 345.90 | | ATR(14) | 18.34 | | 20-day support / resistance | 343.69 / 407.46 | | 3-month low / high | 323.64 / 414.23 | Tesla's next scheduled catalyst in the data provided is the market's reaction to the 407.46 resistance test.Summary Data TSLA
| Last price | 390.84 USD |
| Change 1 day / 5 days / 1 month | 2.91% / 1.47% / 6.45% |
| Trend / MA-cross | sideways / none |
| SMA20 / SMA50 | 381.83 / 373.65 |
| RSI (14) / Stochastic %K | 54.5 / 69.3 |
| Bollinger %B / ATR | 63% / 18.34 |
| Support / Resistance 20 days | 343.69 / 407.46 |
| Data as of | 12 November 2026 04:00 WIB |
| JournalArta research verdict (score) | Hold (+50) |
Today's full Buy and Sell list for US stocks →
Disclaimer: This technical analysis is generated automatically from exchange data and indicators calculated by JournalArta, for information and education only. The verdict and the entry, target and stop-loss levels are not investment advice or a solicitation to buy or sell any security. Investment decisions and their risks rest solely with the reader.
Track TSLA stock price daily: live levels, support/resistance and our full TSLA analysis history.