Regeneron Pharmaceuticals (REGN) Stock Climbs 4.73% on Wednesday, Up 23.3% in a Month
Technical analysis of REGN stock on November 11, 2026: price 959.41 USD, trend uptrend, RSI 69.9, support 782.04, resistance 973.36.
Regeneron Pharmaceuticals (REGN) closed at $959.41 on Wednesday, November 11, 2026, up 4.73% on the day from a previous close of $916.06. The stock is up 3.09% over five days and 23.26% over one month. It now sits about $14 below the 20-day resistance at $973.36 and under the three-month high of $991.73. The question is whether a fast, well-supported advance has room left, or whether it has run ahead of its own trend.
Why REGN is in focus today
- One-day move of 0.00%, about 0.0× its average daily range (ATR)
Selected automatically from 11 NASDAQ (US) stocks by a technical-signal score with daily weighted randomisation — not a recommendation.
Trend & Price Action
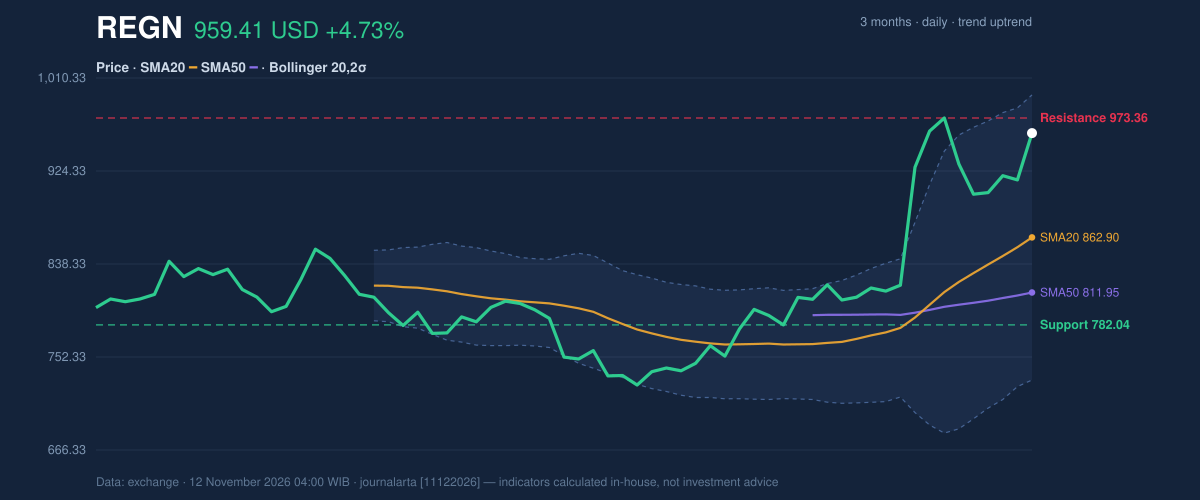
The structure is a clean uptrend. The price is above the 20-day simple moving average (SMA20) at $862.90, which in turn sits above the 50-day average at $811.95. The 20-day average itself rose 5.00% over five days. That is a different measure from the stock's own gain: it shows the average cost of recent buyers climbing steadily, not just one strong session. There is no fresh moving-average crossover, so this trend is established rather than newly triggered.
The stock now trades at 93% of its 20-day range, between support at $782.04 and resistance at $973.36. As shown in the chart, the price has pulled well away from both averages. That gap is typical of a momentum phase, but it also means a pullback toward the averages would be a large move in dollar terms.
Oscillators & Momentum
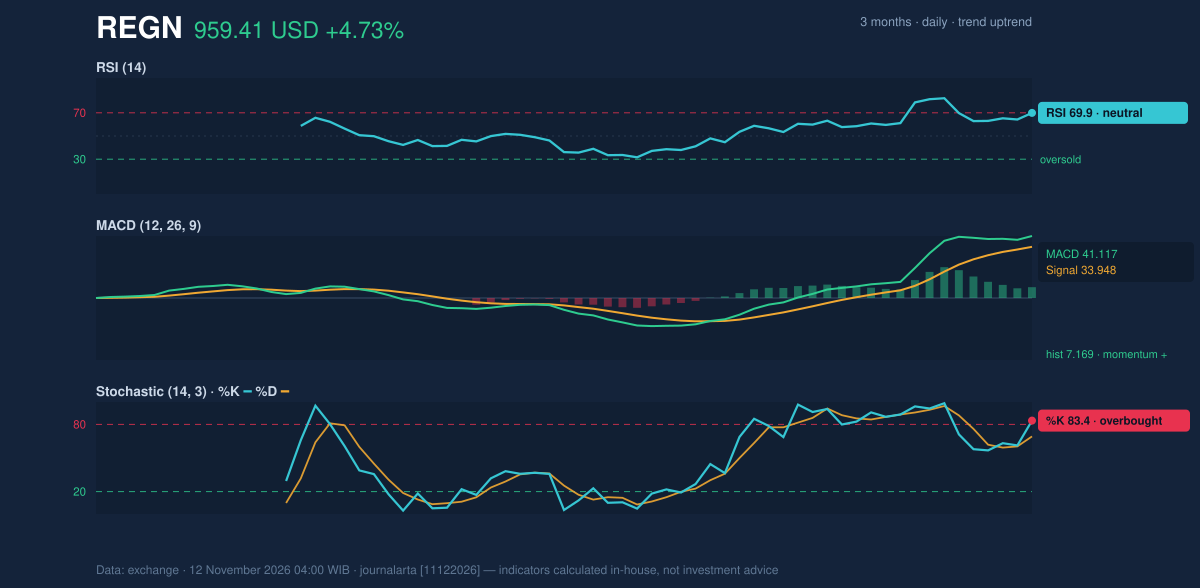
Momentum confirms the trend but is nearing the edge of its comfort zone. The 14-day Relative Strength Index (RSI), which measures the speed of recent gains on a 0–100 scale, reads 69.9. That is classified neutral, but it is just under the 70 line that traders treat as overbought. The Stochastic oscillator is further stretched: %K at 83.4 against %D at 69.3 is in overbought territory, with the faster line pulling away from the slower one.
The MACD, which tracks the gap between short- and long-term averages, supports the advance. It stands at 41.117 against a signal line of 33.948, leaving a positive histogram of 7.169. In plain terms, buying pressure is still widening rather than fading. The mix is worth reading carefully: trend and MACD say strength, while the Stochastic says the move is hot. That combination more often leads to a pause or sideways digestion than to an abrupt reversal, but only if price keeps respecting its averages.
Volatility & Volume
Bollinger Bands, which draw a volatility envelope two standard deviations around the 20-day average, have widened to 30.5% of the price. The upper band is at $994.70, the middle at $862.90 and the lower at $731.11. Price sits at 87% of the band, close to the upper edge. Wide bands signal that the market is already pricing in large swings.
The Average True Range (ATR), a measure of typical daily movement, is 37.01, or 3.9% of the price. A move of that size on any given day is ordinary for this stock right now, which matters when judging how much room a position needs.
Participation backs the rally. Volume reached 1,233,400 shares, 1.3 times the 20-day average of 963,040. On-balance volume (OBV), a running tally that adds volume on up days and subtracts it on down days, is rising. Price and volume are moving together, which is the more convincing version of a breakout attempt.
Fundamental Context
The technical picture follows a strong earnings report. According to its SEC filing (Form 10-Q, filed October 30, 2026), Regeneron reported quarterly revenue of $5.12 billion for the quarter ended September 30, up 36.3% from $3.75 billion a year earlier. Net income was $1.95 billion, against $1.46 billion a year earlier, and diluted earnings per share were $18.45. The company also filed a Form 8-K the same day covering its results of operations and financial condition. Revenue growth of that scale gives the price advance a documented business basis.
Key Levels & Scenarios
The nearest ceiling is the 20-day resistance at $973.36, followed by the three-month high of $991.73 and the upper Bollinger band at $994.70. These three levels sit within about $21 of one another, so they form a single resistance cluster. A close above that zone would open the path toward the targets below. A failure to clear it would leave the stock in a $896–$973 range. On the downside, the SMA20 at $862.90 and support at $782.04 are the next reference points.
Technical Verdict: BUY
JournalArta's research model scores REGN at +68 on a −100 to +100 scale, above the +60 threshold for a BUY call. The strongest reasons:
- Trend structure: price is above the 50-day average, the 20-day average is above the 50-day, and OBV is rising in confirmation.
- Momentum: the MACD histogram is positive at 7.169, and RSI at 69.9 remains in the 50–70 zone.
- Participation: volume at 1.3 times normal supports the move.
The main risk is the overbought Stochastic at 83.4. The verdict is invalidated if price falls below the stop loss at $896.45.
- Entry range: $931.64 – $959.41
- Exit target 1: $1,053.85 (reward/risk 1.5)
- Exit target 2: $1,148.29 (reward/risk 3.0)
- Stop loss: $896.45
This is technical analysis, not an investment recommendation. In plain terms, the chart favors further gains while the stock holds above $896.45, and the call is valid until December 10, 2026.
Summary Data REGN
| Last price | 959.41 USD |
| Change 1 day / 5 days / 1 month | 4.73% / 3.09% / 23.26% |
| Trend / MA-cross | uptrend / none |
| SMA20 / SMA50 | 862.90 / 811.95 |
| RSI (14) / Stochastic %K | 69.9 / 83.4 |
| Bollinger %B / ATR | 87% / 37.01 |
| Support / Resistance 20 days | 782.04 / 973.36 |
| Data as of | 12 November 2026 04:00 WIB |
| JournalArta research verdict (score) | Buy (+68) |
| Entry zone | 931.64 – 959.41 |
| Target 1 / 2 | 1,053.85 / 1,148.29 |
| Stop loss | 896.45 |
| Reward/risk | 1.5 / 3.0 |
Today's full Buy and Sell list for US stocks →
Disclaimer: This technical analysis is generated automatically from exchange data and indicators calculated by JournalArta, for information and education only. The verdict and the entry, target and stop-loss levels are not investment advice or a solicitation to buy or sell any security. Investment decisions and their risks rest solely with the reader.
Track REGN stock price daily: live levels, support/resistance and our full REGN analysis history.