Costco (COST) Stock Climbs 2.01% (November 11, 2026): Up 10.8% in a Month
Technical analysis of COST stock on November 11, 2026: price 1,087.61 USD, trend uptrend, RSI 73.2, support 978.01, resistance 1,087.61.
Why COST is in focus today
- One-day move of 0.00%, about 0.0× its average daily range (ATR)
Selected automatically from 11 NASDAQ (US) stocks by a technical-signal score with daily weighted randomisation — not a recommendation.
Trend & Price Action
Costco has gained 3.93% over five days and 10.75% over one month. Its 20-day simple moving average is $1,020.54, up 2.76% over five days, while the 50-day average is $960.23. With the share price above both averages and the shorter-term average above the longer-term one, the price structure supports an uptrend. No new moving-average crossover has formed, so the trend signal reflects existing conditions, not a fresh technical trigger. The stock is at 100% of its 20-session range, with resistance at $1,087.61, and is close to its three-month high of $1,091.92. That placement shows buyers have driven the price to the top of its recent range; it also leaves little nearby resistance to test before the three-month peak. The upper Bollinger band, at $1,085.17, is already below the latest price, consistent with strong upward pressure but also a possible sign that the move has run ahead of its recent average. The trend is rising, but the price is pressing against resistance rather than clearing it decisively. As shown in the chart, the price sits above both moving averages and beyond the upper Bollinger band.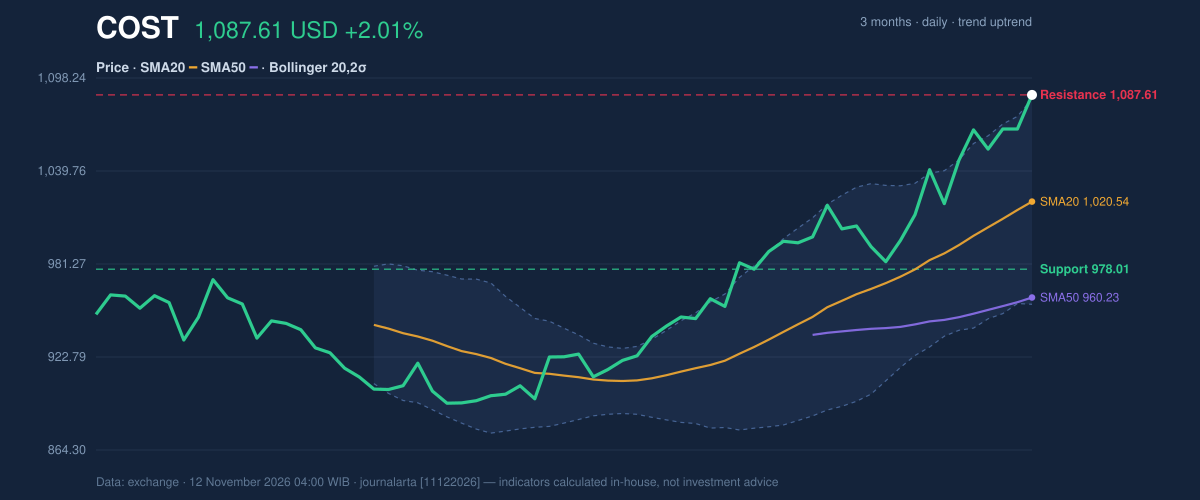
Oscillators & Momentum
The RSI, a measure of the pace and persistence of recent price moves, is 73.2—above the commonly watched 70 threshold for an overbought reading. Stochastic %K is 96.1 and %D is 88.6, also overbought. These readings do not, by themselves, predict a reversal. They do indicate that the rally has been strong enough to raise the risk of a pause or pullback, especially with the price at the range ceiling. MACD remains positive at 31.426, above its 26.310 signal line, and its histogram is positive at 5.116. This supports the direction of the trend, but it does not remove the caution signaled by the oscillators. The signals are therefore mixed: MACD confirms positive momentum, while RSI and Stochastic warn that momentum is stretched.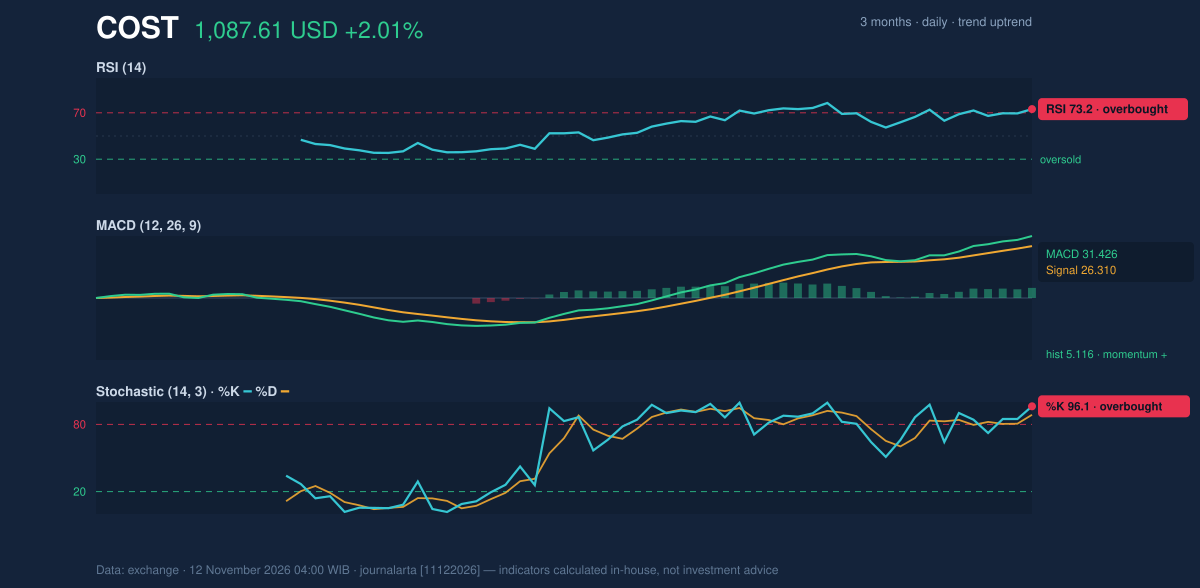
Volatility, Volume & Key Levels
The Bollinger band width is 12.7%, described as normal, rather than a squeeze or an unusually wide expansion. The band’s %B reading of 102% means the share price is above the upper band. ATR, a measure of typical price movement, is $21.74, or 2.0% of the share price—moderate volatility by the supplied data. Trading volume was 2,251,400 shares, or 0.9 times the 20-session average of 2,422,105, so the latest advance was not accompanied by above-average turnover. On the other hand, OBV, which tracks whether volume is flowing more toward buying or selling, is rising. That supports the uptrend, though the light volume tempers the strength of that confirmation. The immediate test is whether the price can close above the 20-session resistance of $1,087.61; the next reference is the three-month high at $1,091.92. A close above resistance would strengthen the upside scenario. Failure to hold the 20-session support at $978.01 would instead weaken the trend; the three-month low is $883.10.Fundamental Context
Costco reported annual revenue of $303.15 billion for the fiscal year ended August 30, 2026, up 10.1% from $275.24 billion a year earlier, according to its SEC filing. The company posted net income of $9.23 billion, compared with $8.10 billion, and diluted earnings per share of $20.76. Those results provide a backdrop of annual growth, but the verdict below is based on technical signals. Costco also filed a Form 8-K with the SEC on November 10 reporting a change of directors or officers and other material events.Technical Verdict: HOLD (wait & see)
The required verdict is HOLD (wait & see), with a score of +58 on a scale from −100 to +100—below the +60 threshold for a buy call. The strongest reasons are the confirmed uptrend with rising OBV, the share price above its 50-day average, and the 20-day average above the 50-day. Against that, RSI and Stochastic are overbought, and the price is at resistance. The verdict is invalidated if the price breaks below the 20-day support at $978.01. The following levels are conditional scenarios based only on the supplied reference levels: - Ideal entry range: $1,087.61 to $1,120.22, only in the upside scenario after a close above 20-day resistance. - Exit target: $1,120.22 in that upside scenario; $1,055.00 as a downside scenario reference if the price breaks below 20-day support. - Stop-loss protection: $1,055.00 in the upside scenario; $883.10 in the downside scenario. In plain English, the uptrend is intact, but overbought momentum and nearby resistance make confirmation important.| Indicator | Reading |
|---|---|
| Latest price | $1,087.61 |
| RSI (14) | 73.2, overbought |
| Stochastic %K / %D | 96.1 / 88.6, overbought |
| MACD / signal / histogram | 31.426 / 26.310 / 5.116 |
| 20-day / 50-day average | $1,020.54 / $960.23 |
| 20-session support / resistance | $978.01 / $1,087.61 |
| Three-month low / high | $883.10 / $1,091.92 |
Summary Data COST
| Last price | 1,087.61 USD |
| Change 1 day / 5 days / 1 month | 2.01% / 3.93% / 10.75% |
| Trend / MA-cross | uptrend / none |
| SMA20 / SMA50 | 1,020.54 / 960.23 |
| RSI (14) / Stochastic %K | 73.2 / 96.1 |
| Bollinger %B / ATR | 102% / 21.74 |
| Support / Resistance 20 days | 978.01 / 1,087.61 |
| Data as of | 12 November 2026 04:00 WIB |
| JournalArta research verdict (score) | Hold (+58) |
Today's full Buy and Sell list for US stocks →
Disclaimer: This technical analysis is generated automatically from exchange data and indicators calculated by JournalArta, for information and education only. The verdict and the entry, target and stop-loss levels are not investment advice or a solicitation to buy or sell any security. Investment decisions and their risks rest solely with the reader.
Track COST stock price daily: live levels, support/resistance and our full COST analysis history.