COST Stock Gains 3.17%, Momentum Gains In Focus
On Juli 17, 2026: price 945.57 USD, trend sideways, RSI 48.7, support 912.97, resistance 965.59. technical analysis of cost stock. Key angle: COST Stock Gains.
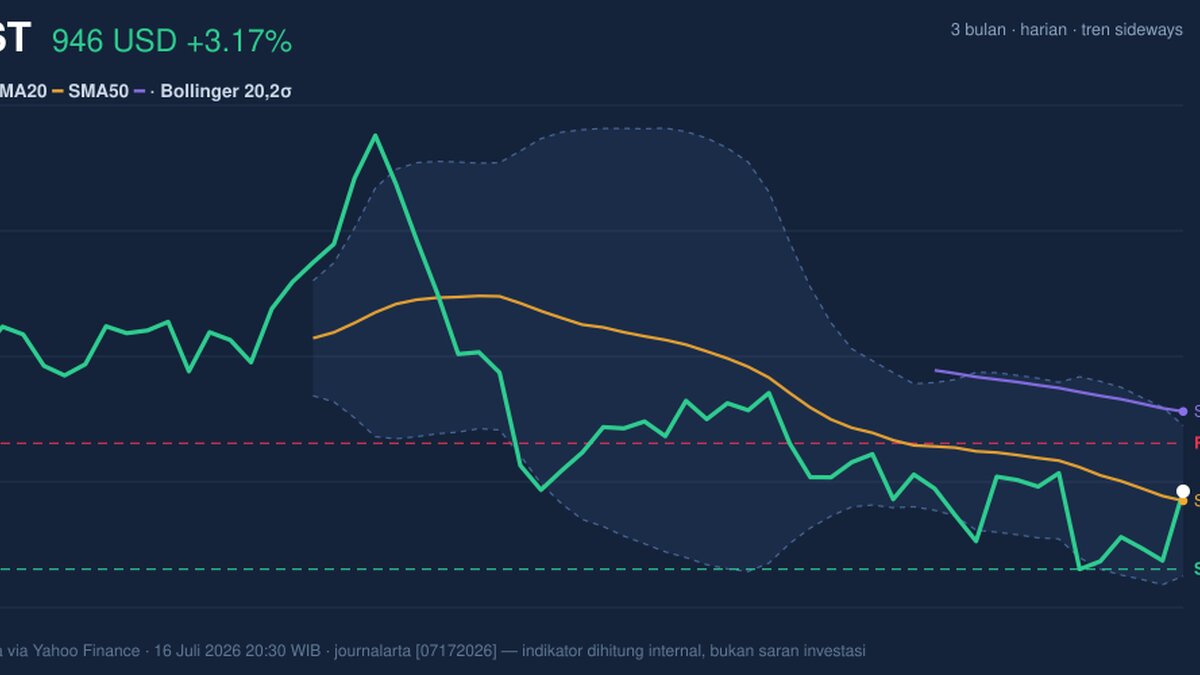
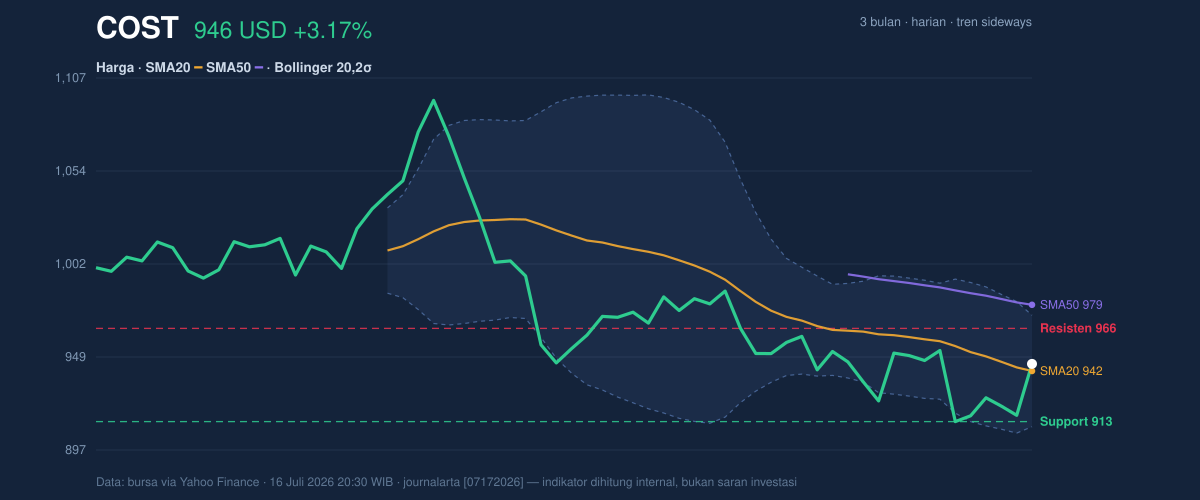
Costco Wholesale Corporation (COST) closed the July 16 session at 945.57 USD, marking a significant 3.17% gain that pushed the stock back above its short-term moving average. This recovery follows a period of consolidation where the equity navigated a broader 1-month decline of 4.17%. By reclaiming the 20-day simple moving average (SMA20) of 941.54 USD, the stock is currently attempting to decouple from its recent downward drift, signaling that institutional participants are actively defending the 910 USD floor.
Retail sentiment often hinges on how a stock interacts with its mid-term trendlines, and Costco’s current positioning relative to the SMA50 of 978.95 USD suggests that while the long-term bullish posture remains intact, the stock is currently digesting a larger move from its 3-month high of 1,096.50 USD.
Trend & Price Action
The current price structure is characterized by a transition from a bearish slope to a localized sideways channel. With the SMA20 declining at a rate of -1.47% over 5 days, the immediate pressure is still tilted toward the downside, yet the recent price jump indicates a shift in the immediate supply-demand equilibrium. Costco is currently trading at 62% of its 20-day range, suggesting it is neither overextended toward the resistance level of 965.59 USD nor overly bearish near its support level of 912.97 USD.
Oscillators & Momentum
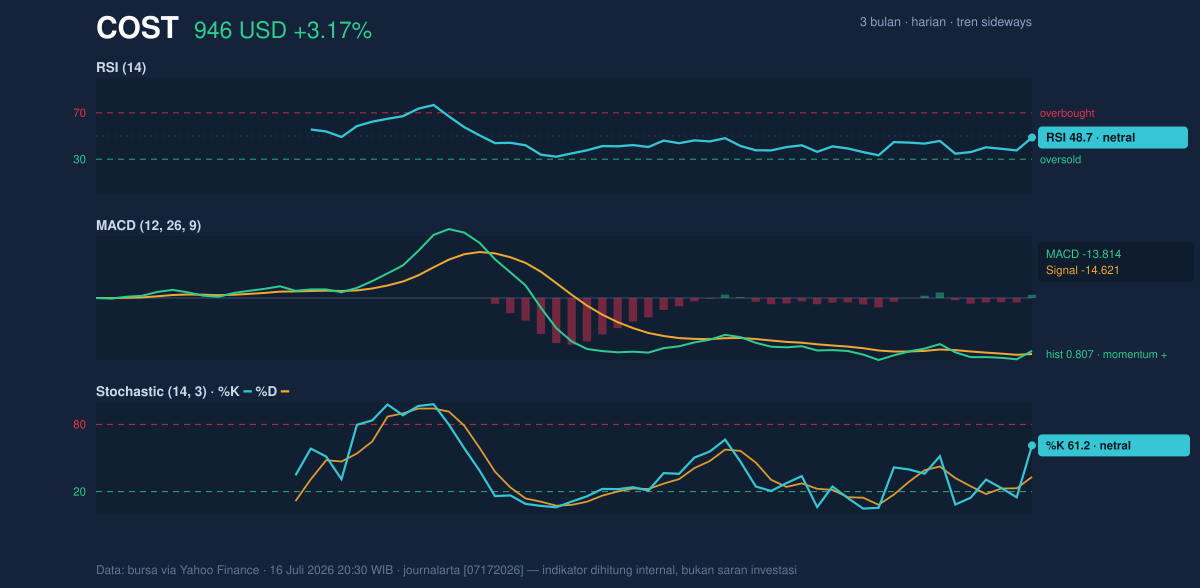
Momentum indicators provide a nuanced view of this recovery. The RSI (14) at 48.7 sits in neutral territory, confirming that the current bounce has not yet reached an overbought state, leaving room for potential expansion. More importantly, the MACD shows a positive histogram of 0.807, as the MACD line sits at -13.814 above the signal line of -14.621. This crossover is a classic technical signal suggesting that bearish momentum is waning. Meanwhile, the Stochastic oscillator at 61.2 (%K) indicates that buyers are gaining control of the daily timeframe without pushing the stock into a reflexive reversal zone.
Volatility & Volume
The Bollinger Band analysis reveals a critical state of compression. With the width of the bands at 6.7%, the stock is in a "squeeze" phase. In market physics, a low-volatility squeeze historically precedes an expansion move. The %B value of 56% confirms the stock is trading comfortably in the upper half of its current volatility envelope. However, traders should note the OBV (On-Balance Volume) is declining, which acts as a cautionary signal. While the price rose on the day, the volume of 2,731,600 remains slightly below the 20-day average of 2,832,955, suggesting that the recent 3.17% climb lacks high-conviction participation from large-volume institutional buyers.
Technical Verdict: HOLD
The technical outlook for Costco is currently neutral, awaiting a decisive break from the Bollinger squeeze to determine the next major move. The verdict rests on the following observations:
* Positive Momentum: The MACD crossover and the successful reclamation of the SMA20 suggest a temporary stabilization of the downward trend.
* Volume Divergence: The decline in OBV alongside a price increase serves as a warning that this recovery move currently lacks the necessary volume to challenge the SMA50 resistance decisively.
* Squeeze Potential: The narrow Bollinger bands (6.7%) signal that a high-volatility breakout is imminent, favoring a wait-and-see approach to determine the direction of the next impulse.
Verdict invalidated if price falls below 910.08 USD, which would signal a breakdown of the Bollinger Band floor and likely trigger a move toward the 3-month low of 907.21 USD.
* Ideal Entry Range: 935.00 – 942.00 USD
* Exit Target (Resistance): 965.59 USD (primary), 978.95 USD (SMA50 secondary)
* Stop Loss Protection: 905.00 USD
The current price action suggests the market is effectively waiting for a clearer signal before committing to the next major direction.
The most recent reported volume of 2,731,600 shares remains 1.0x of the 20-day average, indicating market participation is currently tracking exactly in line with recent historical norms.
Summary Data COST
| Last price | 945.57 USD |
| Change 1 day / 5 days / 1 month | 3.17% / 3.57% / -4.17% |
| Trend / MA-cross | sideways / none |
| SMA20 / SMA50 | 941.54 / 978.95 |
| RSI (14) / Stochastic %K | 48.7 / 61.2 |
| Bollinger %B / ATR | 56% / 20.90 |
| Support / Resistance 20 days | 912.97 / 965.59 |
| Data as of | 16 Juli 2026 20:30 WIB |
Track COST stock price daily: live levels, support/resistance and our full COST analysis history.



