HD Stock Technicals: Gains 4.31% on Thursday, Testing Key Resistance
On October 15, 2026: price 308.24 USD, trend sideways, RSI 58.7, support 281.15, resistance 308.24. technical analysis of hd stock. HD Stock Technicals — full…
Why HD is in focus today
- One-day move of 4.31%, about 2.1× its average daily range (ATR)
- Closed at a 20-day high (308.24)
Selected automatically from 30 NYSE (US) stocks by a technical-signal score with daily weighted randomisation — not a recommendation.
Trend & Price Action
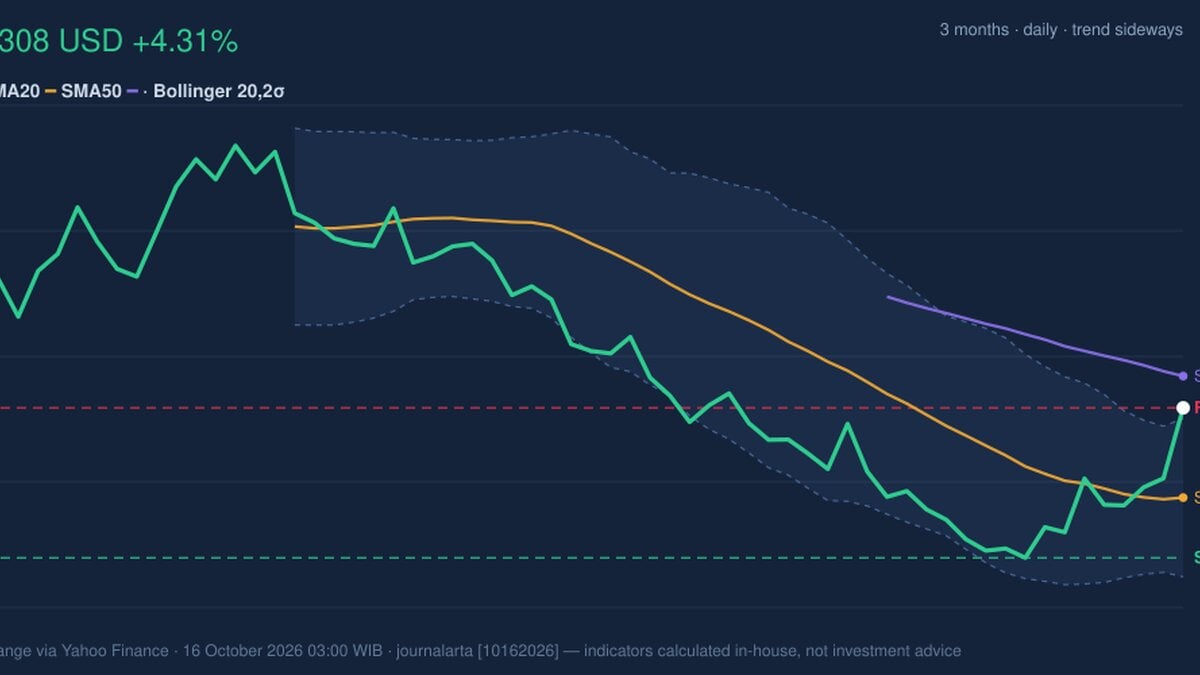
The rally has lifted HD above its 20-day simple moving average (SMA), at $292.02, but the share price remains below its 50-day SMA of $313.97. The 20-day average is sloping down, and there has been no recent moving-average crossover. Together, those readings point to a rebound within a broader sideways pattern, rather than a confirmed trend change. The latest close is also above the upper Bollinger Band, at $306.33. Bollinger Bands map a stock’s recent trading range; a close beyond the upper band can reflect unusually strong buying, but it can also mean price has stretched quickly and may pause. The band width is a normal 9.8%, so the data do not show an exceptionally tight range preceding the move. HD is above its short-term average, but still below the 50-day line and without a fresh crossover to confirm a lasting reversal.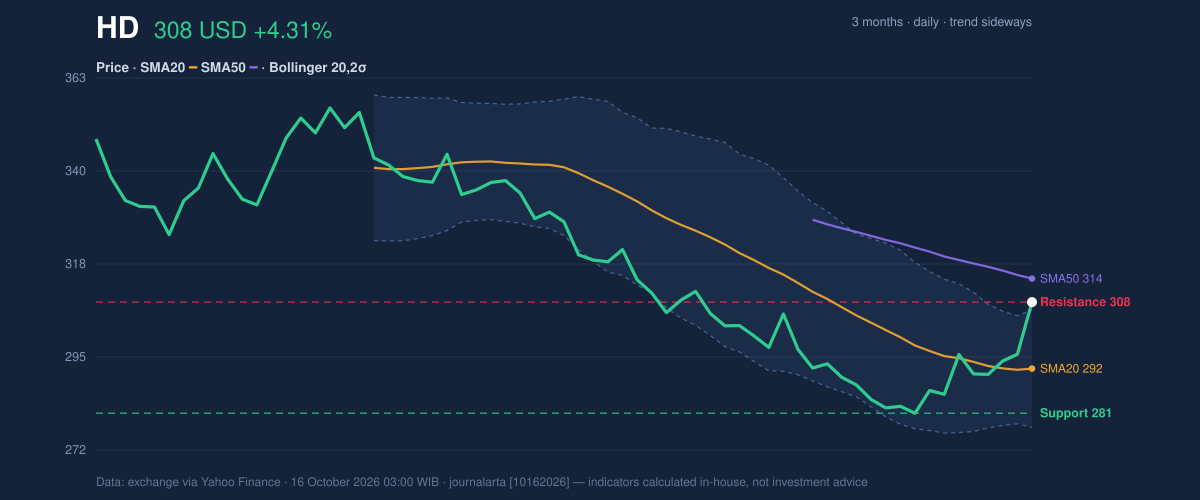
Oscillators & Momentum
Momentum indicators are mixed. The RSI, a measure of the pace and strength of recent price changes, is 58.7, a neutral reading that leaves room for movement in either direction. The Stochastic oscillator is more overheated: %K is 97.3 and %D is 88.5, both consistent with an overbought condition. That does not guarantee a decline, but it warns that the recent advance may be vulnerable to a short-term pause. MACD offers a more constructive signal. Its reading of -4.244 remains below zero, but it is above its signal line of -7.533, producing a positive histogram of 3.289. In plain terms, downward pressure has eased and momentum is improving, even though the indicator has not yet moved into positive territory. RSI is neutral, Stochastic is overbought, and MACD momentum is positive but still below zero. That mix supports the case for a recovery while underscoring the risk of chasing a sharp move.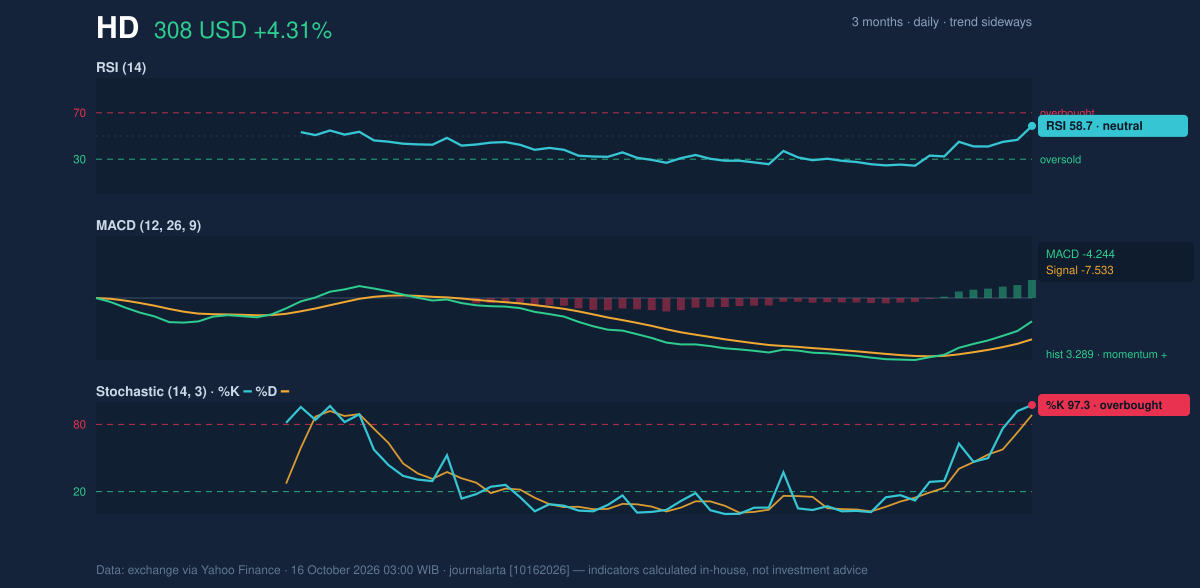
Volatility, Volume & Key Levels
Trading volume of 6,670,900 shares exceeded the 20-day average of 5,771,925, and On-Balance Volume (OBV) is rising. OBV combines price direction with trading volume; its rise suggests participation has generally been accumulating rather than fading. The average true range (ATR), which estimates typical price movement, is $6.45, or 2.1% of the share price—moderate volatility by the supplied readings. The immediate technical test is $308.24, the 20-day resistance level and the stock’s current close. Price is at 100% of its stated 20-day range. A sustained break above that level would show buyers overcoming the immediate ceiling, while failure to hold gains could bring the 20-day average at $292.02 back into focus. Further down, the 20-day support is $281.15, close to the three-month low of $277.15. The three-month high is $358.36. Support stands at $281.15, while $308.24 is the immediate resistance that the rally must clear to extend. The close above the upper Bollinger Band adds urgency to that test: continued strength would reinforce momentum, but a return inside the band would signal that the breakout attempt is losing force.Technical Verdict: HOLD (wait & see)
HOLD (wait & see) is the clearest reading of the mixed signals. HD has risen above its 20-day SMA, MACD momentum is positive, and rising OBV with above-average volume supports the advance. Against that, price remains below the 50-day SMA, Stochastic is overbought, and the close is at the stated 20-day resistance. The verdict is invalidated if price falls below the $281.15 support level. - Ideal entry range: $292.02–$308.24, bounded by the 20-day SMA and immediate resistance. - Exit target: $313.97, the 50-day SMA and next cited technical level above resistance. - Stop-loss protection: $281.15, the 20-day support level. For non-traders, the indicators show a strong rebound, but not yet enough confirmation to distinguish a lasting turn from a short-lived surge. *Data table — HD, NYSE (USD; market data via Yahoo Finance, as of Oct. 16, 2026, 03:00 WIB)* | Indicator | Reading | |---|---:| | Last price | $308.24 | | Previous close | $295.51 | | Change: 1 day / 5 days / 1 month | 4.31% / 4.32% / 1.89% | | SMA20 / SMA50 | $292.02 / $313.97 | | Bollinger upper / middle / lower | $306.33 / $292.02 / $277.71 | | Bollinger %B / width | 107% / 9.8% | | RSI(14) | 58.7 | | Stochastic %K / %D | 97.3 / 88.5 | | MACD / signal / histogram | -4.244 / -7.533 / 3.289 | | ATR(14) | $6.45 (2.1%) | | Volume / 20-day average | 6,670,900 / 5,771,925 | | 20-day support / resistance | $281.15 / $308.24 | | Three-month high / low | $358.36 / $277.15 |Summary Data HD
| Last price | 308.24 USD |
| Change 1 day / 5 days / 1 month | 4.31% / 4.32% / 1.89% |
| Trend / MA-cross | sideways / none |
| SMA20 / SMA50 | 292.02 / 313.97 |
| RSI (14) / Stochastic %K | 58.7 / 97.3 |
| Bollinger %B / ATR | 107% / 6.45 |
| Support / Resistance 20 days | 281.15 / 308.24 |
| Data as of | 16 October 2026 03:00 WIB |
Disclaimer: This technical analysis is generated automatically from exchange data (via Yahoo Finance) and indicators calculated by JournalArta, for information and education only. The verdict and the entry, target and stop-loss levels are not investment advice or a solicitation to buy or sell any security. Investment decisions and their risks rest solely with the reader.
Track HD stock price daily: live levels, support/resistance and our full HD analysis history.