XOM Stock Drops 1.32%, Testing Key Resistance In Focus
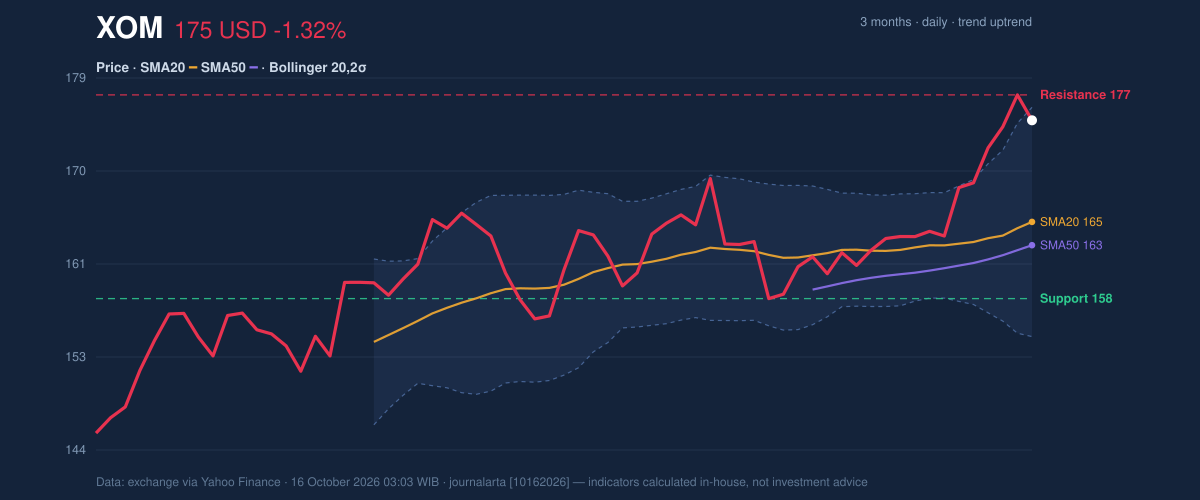
On October 15, 2026: price 174.68 USD, trend uptrend, RSI 68.3, support 158.30, resistance 177.01. technical analysis of xom stock. XOM Stock Drops — full…
Trend & Price Action
Oscillators & Momentum
Momentum indicators remain broadly supportive, though they suggest the advance is becoming more extended. The RSI is 68.3, classified as neutral in the supplied data; it is elevated but has not crossed into an overbought reading under that classification. The Stochastic readings are also labeled neutral: %K at 79.4 and %D at 90.6. With %K below %D, the short-term oscillator is not confirming an acceleration at the latest reading. The MACD remains positive, at 3.321 versus a signal line of 2.066, with a positive histogram of 1.254. This means the faster trend measure is still above its signal line, consistent with the broader price advance. The indicators therefore tell a mixed but coherent story: the trend and MACD are constructive, while the elevated Stochastic readings and proximity to resistance make near-term follow-through less certain. [ GRAFIK-MOMENTUM ]Volatility & Volume
The Bollinger Band position is high: %B is 94%, placing the share price near the upper band. Band width is 12.7%, described as normal rather than compressed, so the data do not signal a volatility squeeze that might precede an unusually sharp move. The upper-band proximity can mark strong buying pressure, but it can also leave the stock vulnerable to a pause if buyers fail to push through resistance. Average True Range (ATR) is $3.41, or 2.0% of the share price, indicating moderate day-to-day volatility. Volume was 11.23 million shares, about 0.9 times its 20-day average of 12.97 million. The rise in on-balance volume (OBV), which tracks whether volume generally accompanies up or down sessions, suggests accumulation remains supportive even though the latest session’s trading was below normal.Key Levels & Scenarios
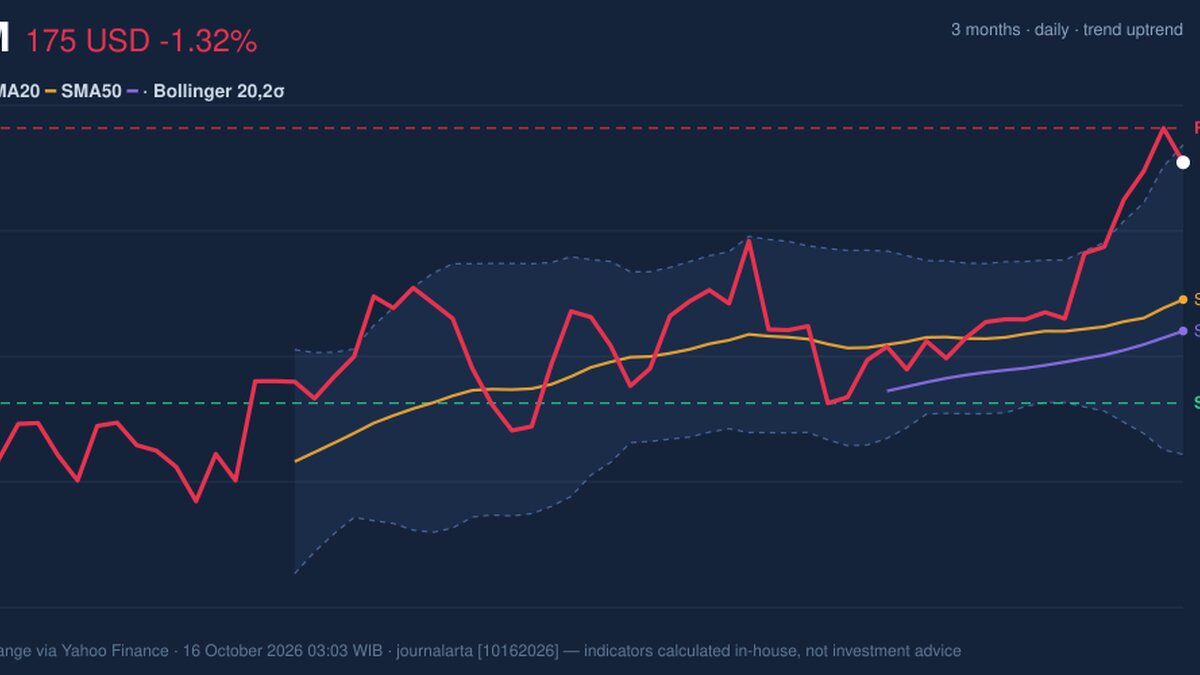
A move through $177.01 resistance would put the shares closer to their three-month high of $178.69 and would show that buyers can overcome the immediate ceiling. Failure to clear that area, especially alongside the high Bollinger %B and a Stochastic %K below %D, could leave XOM consolidating. A decline toward $165.34, where the 20-day SMA sits, would test whether the recent advance has enough support beneath it; the more consequential 20-day range floor is $158.30. [ GRAFIK-HARGA ]Technical Verdict: HOLD (wait & see)
The technical balance favors patience rather than a directional call. The rising 20-day SMA and price above both moving averages support the uptrend; positive MACD and rising OBV add confirmation. Against that, the share price is near resistance and the upper Bollinger Band, while the Stochastic readings do not show fresh short-term acceleration. - Ideal entry range: $165.34–$177.01, bounded by the 20-day SMA and 20-day resistance. - Exit target: $177.01–$178.69, spanning resistance to the three-month high. - Stop-loss protection: $158.30, the 20-day support level. - Invalidation: The HOLD view is invalidated if price falls below $158.30. For non-traders, the chart remains upward-leaning, but the price is close enough to resistance that confirmation matters more than momentum alone.Data table — XOM, NYSE (US), as of October 16, 2026, 03:03 WIB
Why XOM is in focus today
- Uptrend confirmed (5-day change 3.67%)
Selected automatically from 30 NYSE (US) stocks by a technical-signal score with daily weighted randomisation — not a recommendation.
| Measure | Reading |
|---|---|
| Last price | $174.68 |
| Daily change | -1.32% |
| Five-day / one-month change | +3.67% / +6.99% |
| SMA20 / SMA50 | $165.34 / $163.21 |
| Bollinger upper / middle / lower | $175.87 / $165.34 / $154.81 |
| RSI / Stochastic %K and %D | 68.3 / 79.4 and 90.6 |
| MACD / signal / histogram | 3.321 / 2.066 / 1.254 |
| ATR / volume | $3.41 / 11,227,700 |
| 20-day support / resistance | $158.30 / $177.01 |
| Three-month high / low | $178.69 / $144.55 |
Summary Data XOM
| Last price | 174.68 USD |
| Change 1 day / 5 days / 1 month | -1.32% / 3.67% / 6.99% |
| Trend / MA-cross | uptrend / none |
| SMA20 / SMA50 | 165.34 / 163.21 |
| RSI (14) / Stochastic %K | 68.3 / 79.4 |
| Bollinger %B / ATR | 94% / 3.41 |
| Support / Resistance 20 days | 158.30 / 177.01 |
| Data as of | 16 October 2026 03:03 WIB |
Disclaimer: This technical analysis is generated automatically from exchange data (via Yahoo Finance) and indicators calculated by JournalArta, for information and education only. The verdict and the entry, target and stop-loss levels are not investment advice or a solicitation to buy or sell any security. Investment decisions and their risks rest solely with the reader.
Track XOM stock price daily: live levels, support/resistance and our full XOM analysis history.