Atlassian (TEAM) Stock Climbs 2.58%: Down 25.5% in a Month
Technical analysis of TEAM stock on November 11, 2026: price 152.44 USD, trend sideways, RSI 28.8, support 148.60, resistance 227.61.

Nasdaq data for the Wednesday, November 11, 2026 session show Atlassian (TEAM) closing at $152.44, up 2.58% from the previous close of $148.60. The gain is small. It follows a 19.72% fall over five days and a 25.52% slide over one month, so the one-day move barely dents the damage.
Why TEAM is in focus today
- One-day move of 0.00%, about 0.0× its average daily range (ATR)
Selected automatically from 11 NASDAQ (US) stocks by a technical-signal score with daily weighted randomisation — not a recommendation.
Trend & Price Action
The shares sit well below the 20-day simple moving average (SMA20) of 197.84 and below the 50-day average of 193.74. A moving average smooths recent closing prices, so a price this far beneath both says buyers have been losing for weeks. The 20-day average itself fell 5.67% over five days, and it still sits above the 50-day. No new crossover has formed between the two averages.
The code-generated trend label reads sideways. The five-day drop of nearly 20% argues against calling it calm. A more accurate reading is a sharp break from a higher range that has not yet found a floor.
As shown in the chart below, price has dropped from the middle of its Bollinger band toward the lower edge.
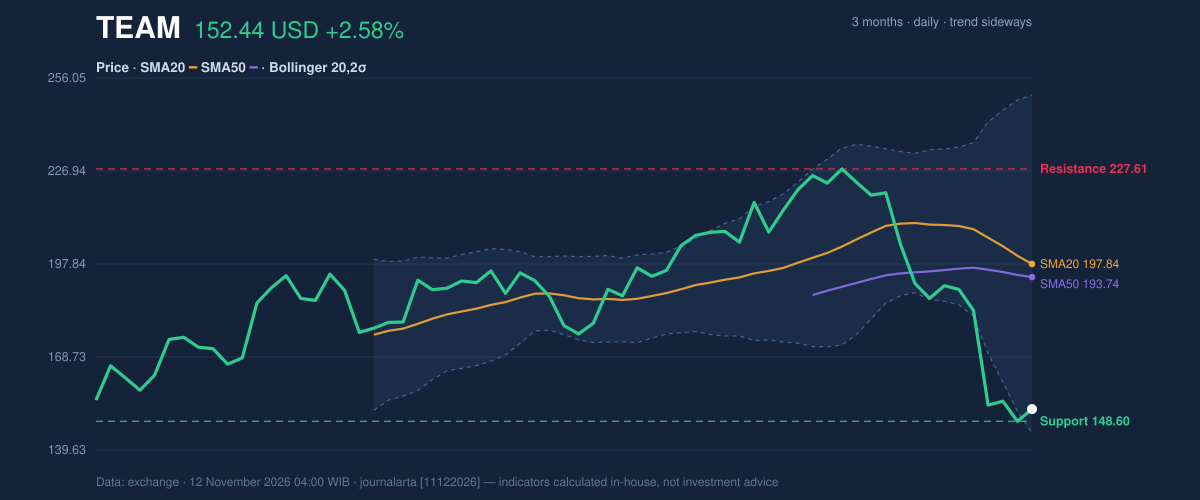
The shares trade at roughly 5% of their 20-day range, between support at 148.60 and resistance at 227.61. The three-month high is 229.96 and the three-month low is 144.99, so the stock is just $7.45 above its floor of the past three months. Last session's close of 148.60 is exactly the 20-day support. The stock bounced from the level that is now its nearest line of defense.
Oscillators & Momentum
Momentum gauges are deeply stretched to the downside. The 14-day Relative Strength Index (RSI), which measures how fast prices have moved on a 0–100 scale, stands at 28.8. Readings below 30 are conventionally called oversold. The Stochastic oscillator, which compares the close with the recent trading range, is lower still, with %K at 9.0 and %D at 6.8.
Oversold means selling has been unusually one-sided. It does not mean the decline is over. Readings can stay depressed for days while a stock keeps falling.
The MACD (a trend-following gauge built from two moving averages) points the same way. It sits at -11.709 against a signal line of -4.053, leaving a histogram of -7.656. The gap between the lines is wide and negative, which indicates downside momentum is still accelerating rather than fading.
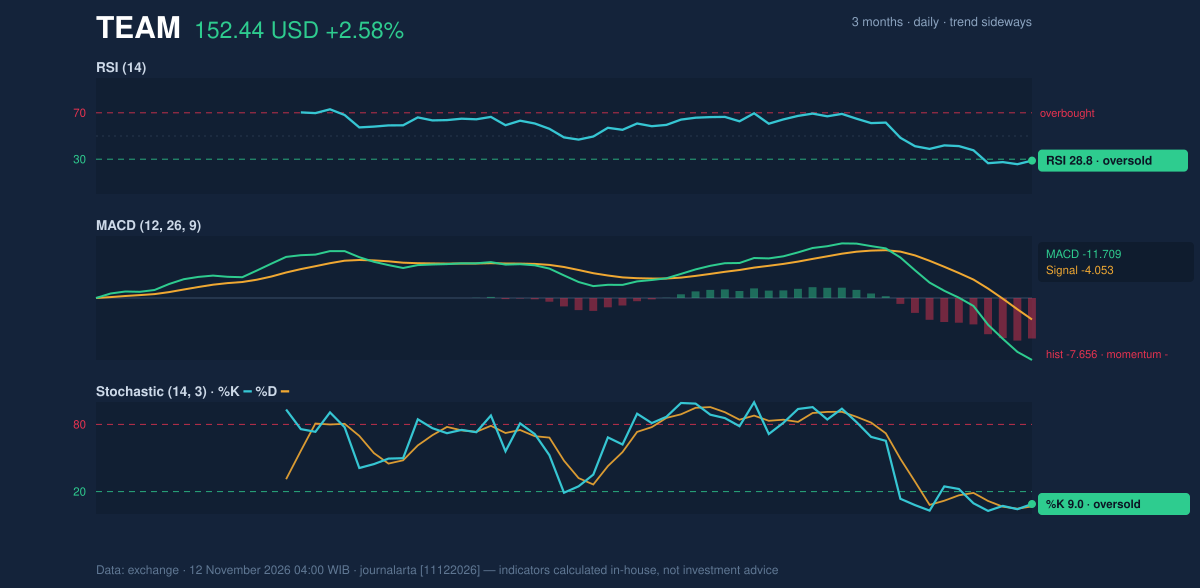
Together, these indicators describe a market that is stretched but not yet turning. A genuine reversal would typically show the Stochastic lines crossing upward and the MACD histogram shrinking. Neither has happened.
Volatility & Volume
The Bollinger bands (two standard deviations around the 20-day average) have widened to 53.5% of the middle line, which signals high volatility. The upper band is 250.75, the middle 197.84 and the lower 144.92. The %B reading of 7% puts price just above that lower band. The Average True Range (ATR) is 11.53, or 7.6% of the share price. That implies a typical daily swing of roughly one-fifteenth of the stock's value, large for a large-cap name.
Volume offers little confirmation. The session traded 3,287,400 shares against a 20-day average of 3,391,600, or 1.0 times normal. The On-Balance Volume (OBV) indicator, which adds volume on up days and subtracts it on down days, is falling. A bounce on ordinary volume while OBV keeps sinking suggests the rebound has drawn little fresh buying.
Fundamental Context
Technical Verdict: HOLD (wait & see)
JournalArta's research board scores TEAM at -10 on a −100 to +100 scale, short of the +60 Buy and −60 Sell thresholds. Trend and momentum are not aligned yet.
- Upside scenario: a close above the 20-day resistance at 227.61.
- Downside scenario: a break below the 20-day support at 148.60.
In plain terms: TEAM has no clear direction yet; 227.61 and 148.60 are the levels that decide the next move.
Key Levels & Scenarios
The reference levels computed from the data frame the near-term map. The 20-day support at 148.60 is the line to watch. If the stock breaks below 148.60, the next markers are the three-month low of 144.99 and the lower Bollinger band at 144.92. The price minus 1.5 times ATR is 135.15. If it holds, the first test is the price plus 1.5 times ATR at 169.73, well short of the 20-day average at 197.84.
Technical Verdict: HOLD (wait & see)
The JournalArta research score is -10 on a scale running from -100 to +100. Positive calls start at +60 and negative ones at -60, so the reading sits in the middle band. The verdict is HOLD (wait & see) because trend and momentum are not yet aligned.
- Trend is damaged: price sits below the SMA20 and SMA50, and the 20-day average fell 5.67% over five days.
- Momentum is oversold but still falling: RSI at 28.8 and Stochastic %K at 9.0 are stretched, while the MACD histogram at -7.656 shows no sign of turning.
- Participation is thin: volume was 1.0 times normal and OBV is down, so the bounce lacks confirmation.
The verdict would be invalidated by a close above 227.61, or by a break below 148.60. Both are conditional scenarios, drawn only from the reference levels:
- Upside scenario: entry range on a daily close above 227.61; exit target 229.96 (three-month high); stop loss 197.84 (SMA20).
- Downside scenario: entry range on a break below 148.60; exit target 135.15 (price minus 1.5 times ATR); stop loss 152.44 (last close).
In plain terms, the technical picture says to wait: the stock has fallen hard and may be due a pause, but nothing on the chart yet shows the fall has ended, and the last close of $152.44 sits just $3.84 above the 20-day support.
Summary Data TEAM
| Last price | 152.44 USD |
| Change 1 day / 5 days / 1 month | 2.58% / -19.72% / -25.52% |
| Trend / MA-cross | sideways / none |
| SMA20 / SMA50 | 197.84 / 193.74 |
| RSI (14) / Stochastic %K | 28.8 / 9.0 |
| Bollinger %B / ATR | 7% / 11.53 |
| Support / Resistance 20 days | 148.60 / 227.61 |
| Data as of | 12 November 2026 04:00 WIB |
| JournalArta research verdict (score) | Hold (-10) |
Today's full Buy and Sell list for US stocks →
Disclaimer: This technical analysis is generated automatically from exchange data and indicators calculated by JournalArta, for information and education only. The verdict and the entry, target and stop-loss levels are not investment advice or a solicitation to buy or sell any security. Investment decisions and their risks rest solely with the reader.
Track TEAM stock price daily: live levels, support/resistance and our full TEAM analysis history.