TSLA Stock Drops 2.13% on Friday, Testing Support Level
On October 16, 2026: price 354.72 USD, trend sideways, RSI 41.8, support 352.84, resistance 382.70. technical analysis of tsla stock. TSLA Stock Drops — full…
Trend & Price Action
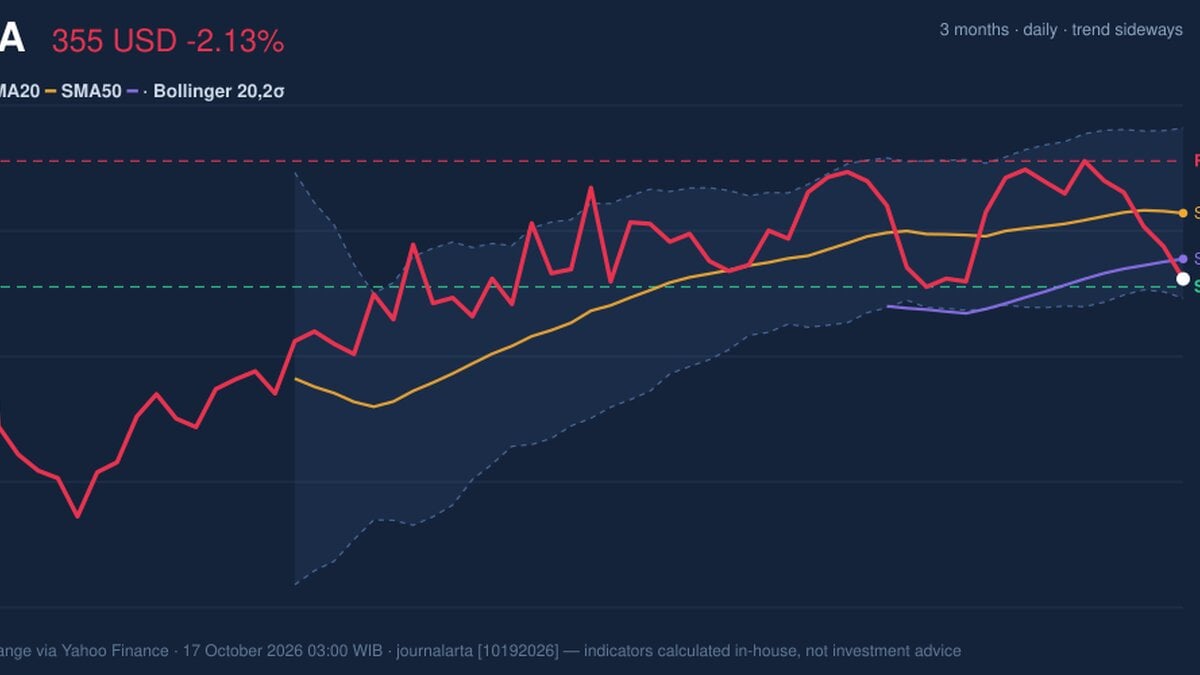
Tesla is down 7.31% over five days and 2.62% over one month, despite a slightly rising 20-day average. At $354.72, the stock sits below its 20-day simple moving average of $370.33 and its 50-day average of $359.46. Those averages summarize recent prices; trading below both indicates that the short-term price structure is weaker than those reference periods, though no new crossover between the averages has occurred. The broader trend remains sideways rather than decisively downward. Still, Tesla is near the bottom of its 20-day range, whose support is $352.84 and resistance is $382.70. The 20-day Bollinger lower band, a measure of the recent range adjusted for volatility, is $350.14; the price is near it, with the band reading at 11% of the distance between its lower and upper edges. This points to a weak position within the band, not by itself a confirmed reversal. As shown in the chart, the relationship between price, moving averages and the Bollinger bands captures the tension: Tesla is near short-term support, but remains below both averages.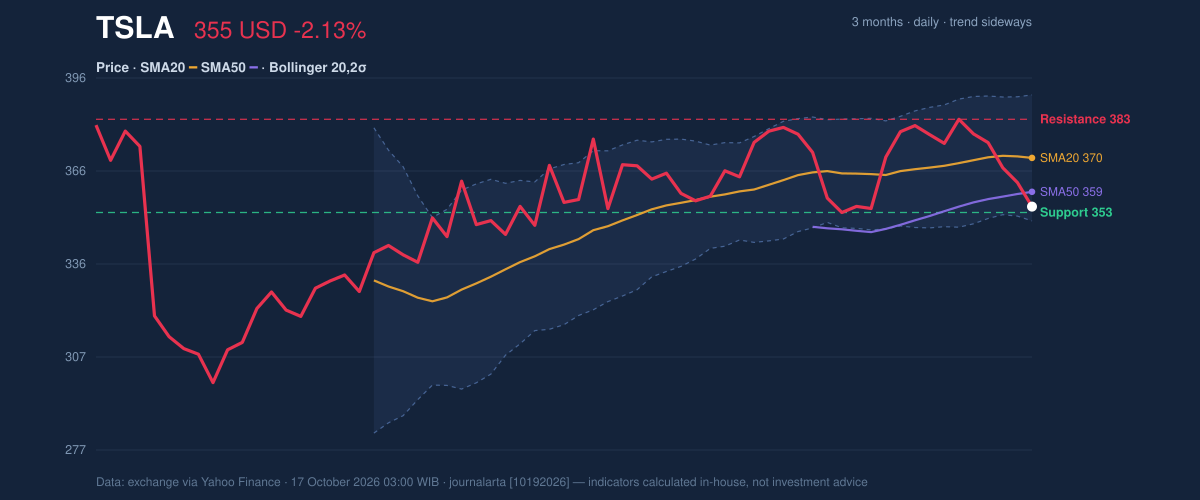
Oscillators & Momentum
Momentum indicators are mixed but lean negative. The RSI is 41.8, in neutral territory; it does not show an extreme condition that would, on its own, imply the recent drop has gone too far. The Stochastic readings are also classified as neutral, with %K at 20.7 and %D at 36.5. The lower %K reading shows weaker recent momentum, but the data do not establish a confirmed turn higher. The clearest caution comes from the MACD: its histogram is negative at -2.155, with the MACD below its signal line. This means the recent momentum reading is weakening rather than confirming a recovery. Together, the indicators describe a stock under pressure, but without a strong oversold signal to validate a rebound.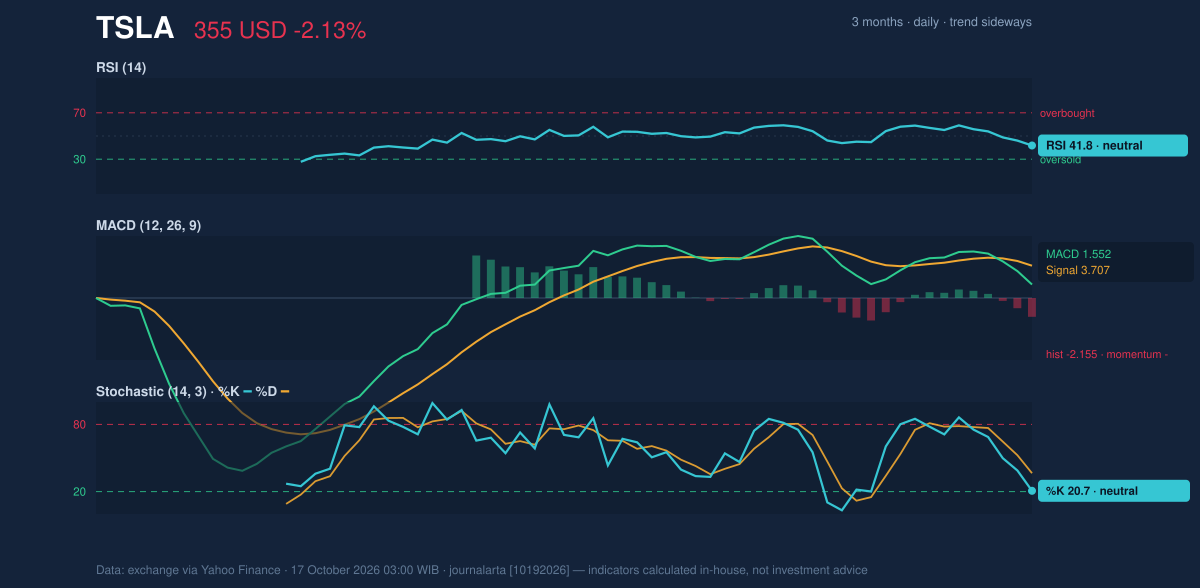
Volatility, Volume & Key Levels
Tesla’s latest volume of 61.9 million shares was 1.8 times its 20-day average of 34.5 million. A high-volume decline can indicate that more participants were active in the move; the falling OBV, which tracks volume alongside price direction, adds to the evidence that buying participation has not improved. It does not, however, reveal why investors traded. Volatility is moderate: the 14-day average true range is $10.86, or 3.1% of the share price. The Bollinger band width of 10.9% is described as normal, so the available data do not show an unusually tight setup that would signal a pending volatility breakout. The immediate test is $352.84 support, close to the lower Bollinger band at $350.14. A sustained break below those levels would weaken the near-term structure. If support holds, a recovery would first need to regain the $359.46 50-day average and then the $370.33 20-day average; the 20-day resistance is $382.70. Tesla’s three-month range extends from $297.38 to $388.56, showing that the current weakness has not taken the stock to its period low.Technical Verdict: HOLD (wait & see)
The technical picture supports a neutral stance rather than a directional call: price is below both moving averages, MACD momentum is negative, and heavy volume with falling OBV confirms that selling pressure remains relevant. Against that, RSI is neutral and price is close to support, leaving room for stabilization if that level holds. The verdict is invalidated if the price falls below $352.84 support.- Ideal entry range: $352.84–$359.46, bounded by 20-day support and the 50-day average.
- Exit target: $370.33–$382.70, from the 20-day average to 20-day resistance.
- Stop-loss protection: below $350.14, the lower Bollinger band.
Market data: exchange data via Yahoo Finance, as of October 17, 2026, 03:00 WIB. Technical analysis is not an investment recommendation.
Why TSLA is in focus today
- Volume at 1.8× the 20-day average
Selected automatically from 32 NASDAQ (US) stocks by a technical-signal score with daily weighted randomisation — not a recommendation.
Summary Data TSLA
| Last price | 354.72 USD |
| Change 1 day / 5 days / 1 month | -2.13% / -7.31% / -2.62% |
| Trend / MA-cross | sideways / none |
| SMA20 / SMA50 | 370.33 / 359.46 |
| RSI (14) / Stochastic %K | 41.8 / 20.7 |
| Bollinger %B / ATR | 11% / 10.86 |
| Support / Resistance 20 days | 352.84 / 382.70 |
| Data as of | 17 October 2026 03:00 WIB |
Disclaimer: This technical analysis is generated automatically from exchange data (via Yahoo Finance) and indicators calculated by JournalArta, for information and education only. The verdict and the entry, target and stop-loss levels are not investment advice or a solicitation to buy or sell any security. Investment decisions and their risks rest solely with the reader.
Track TSLA stock price daily: live levels, support/resistance and our full TSLA analysis history.