PFE Stock Gains 0.48%, Testing Key Resistance In Focus
On October 16, 2026: price 29.58 USD, trend uptrend, RSI 69.7, support 27.41, resistance 29.58. technical analysis of pfe stock. PFE Stock Gains — full details…
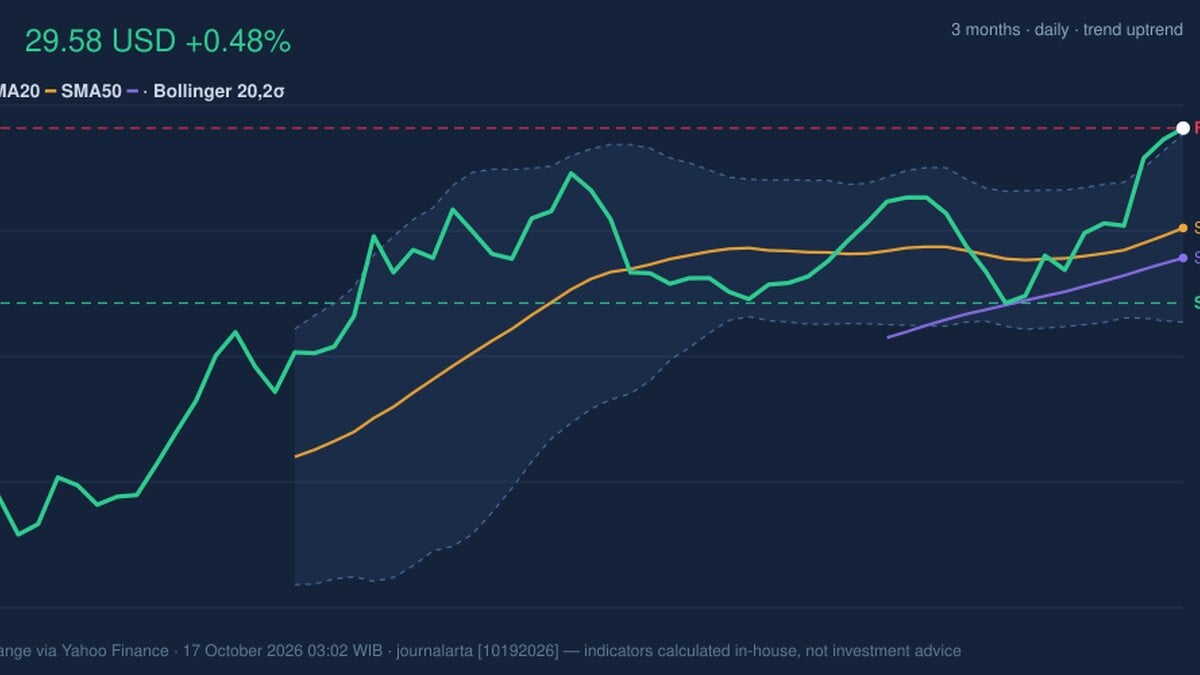
Why PFE is in focus today
- Closed at a 20-day high (29.58)
- Trading near its 3-month high (29.88)
- Uptrend confirmed (5-day change 4.60%)
Selected automatically from 30 NYSE (US) stocks by a technical-signal score with daily weighted randomisation — not a recommendation.
Trend & Price Action
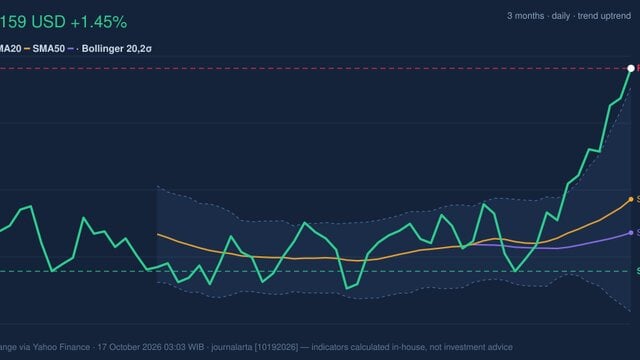
Pfizer’s shares are above the 20-day simple moving average (SMA) of $28.34 and the 50-day SMA of $27.97. The SMA20 has risen 1.24% over five days, a sign that the recent advance is gaining traction rather than merely reflecting a one-day jump. There has been no new moving-average crossover, however, so the data do not show a fresh long-term trend signal. The shares gained 0.48% on the day and 6.94% over the past month. They now sit at the top of their 20-day range and near the three-month high of $29.88. That position confirms buyers have driven the recent rise, but leaves little room before the nearest recorded resistance.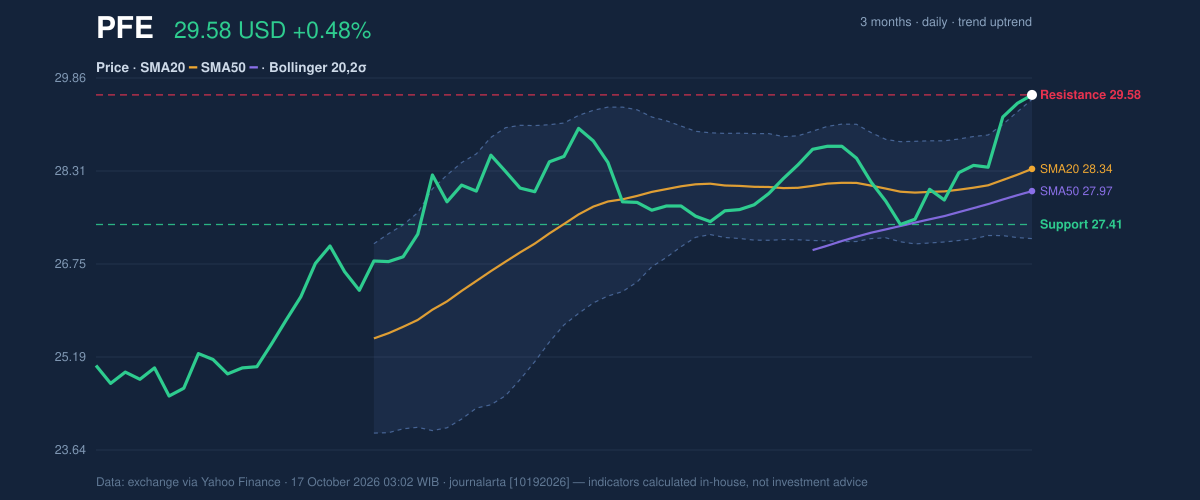
Oscillators & Momentum
The momentum indicators point in different directions at the margin. RSI, a measure of the speed and size of recent price changes, is 69.7 and classified as neutral in the supplied data. Stochastic %K is 89.1 and %D is 87.1, both consistent with an overbought reading: the price has risen quickly relative to its recent range. MACD is positive at 0.354, above its 0.217 signal line, and its histogram is positive at 0.136. This combination indicates that upward momentum remains in place. The positive MACD supports the trend, while the overbought Stochastic warns that the rally may be vulnerable to consolidation.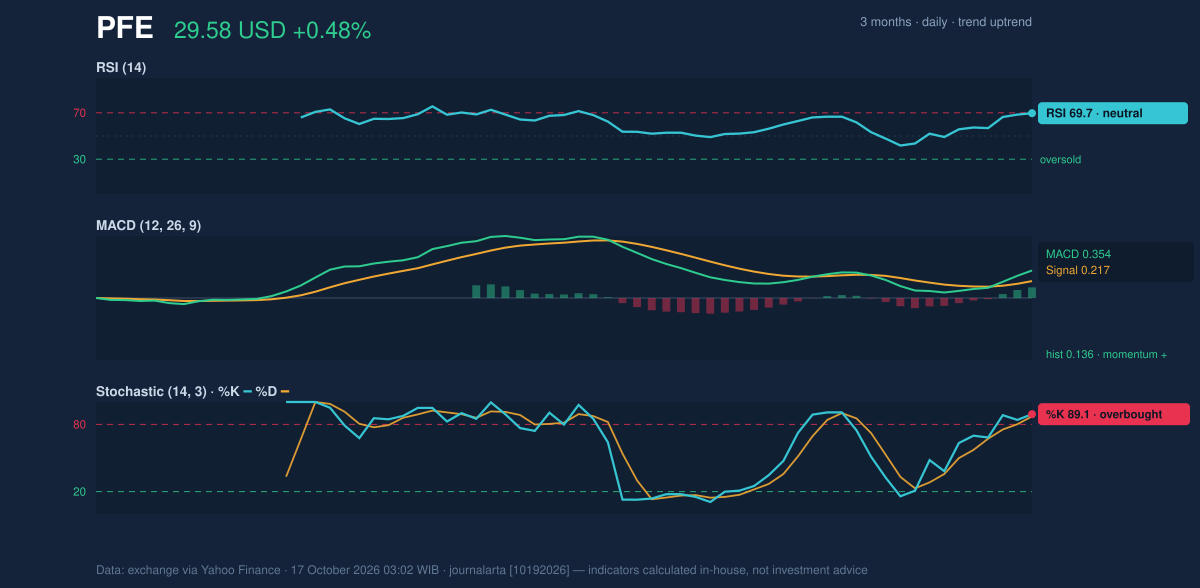
Volatility & Volume
Pfizer’s average true range (ATR) is $0.57, or 1.9% of the share price, pointing to moderate day-to-day movement in the data. That matters near resistance: a move of ordinary daily size could bring the shares back toward nearby support or extend the test of the three-month high, without by itself establishing a change in trend. Trading volume was 28,612,900 shares, about 0.9 times the 20-day average of 30,568,450. The session’s advance therefore came on slightly lighter-than-usual participation. On-balance volume (OBV), which tracks whether volume is associated with rising or falling prices, is increasing. Rising OBV offers some confirmation of accumulation, although below-average volume makes the latest push less emphatic.Key Levels & Scenarios
The supplied 20-day resistance is $29.58, the same as the latest close; the nearest higher reference is the three-month high of $29.88. A sustained move through those levels would show the price escaping its current ceiling. If the shares fail to hold the breakout area, the 20-day support at $27.41 is the key stated level to watch, with the 50-day SMA at $27.97 and lower Bollinger Band at $27.18 providing additional reference points. Support is $27.41, while resistance is $29.58, with the three-month high at $29.88. These levels frame a market near its recent top, where momentum is positive but the short-term oscillators argue against treating strength as a one-way signal.Technical Verdict: HOLD
HOLD (wait & see) is the technical reading: the upward trend and positive MACD are counterbalanced by an overbought Stochastic, a close above the upper Bollinger Band, and resistance at the current price. The verdict is invalidated if the price falls below the stated 20-day support of $27.41.- Ideal Entry Range: $28.34–$27.41, framed by the SMA20 and 20-day support.
- Exit Target: $29.88, the three-month high and nearest higher reference level.
- Stop Loss: $27.18, the lower Bollinger Band.
| Measure | Latest reading |
|---|---|
| Last price | $29.58 |
| SMA20 / SMA50 | $28.34 / $27.97 |
| RSI / Stochastic | 69.7 / 89.1 (%K), 87.1 (%D) |
| MACD / signal | 0.354 / 0.217 |
| 20-day support / resistance | $27.41 / $29.58 |
| Three-month high / low | $29.88 / $24.44 |
Summary Data PFE
| Last price | 29.58 USD |
| Change 1 day / 5 days / 1 month | 0.48% / 4.60% / 6.94% |
| Trend / MA-cross | uptrend / none |
| SMA20 / SMA50 | 28.34 / 27.97 |
| RSI (14) / Stochastic %K | 69.7 / 89.1 |
| Bollinger %B / ATR | 103% / 0.57 |
| Support / Resistance 20 days | 27.41 / 29.58 |
| Data as of | 17 October 2026 03:02 WIB |
Disclaimer: This technical analysis is generated automatically from exchange data (via Yahoo Finance) and indicators calculated by JournalArta, for information and education only. The verdict and the entry, target and stop-loss levels are not investment advice or a solicitation to buy or sell any security. Investment decisions and their risks rest solely with the reader.
Track PFE stock price daily: live levels, support/resistance and our full PFE analysis history.