Visa Stock Technicals: Gains 0.72% on Friday, RSI Overbought
On October 16, 2026: price 402.61 USD, trend uptrend, RSI 73.6, support 359.33, resistance 402.61. technical analysis of visa stock. Visa Stock Technicals —…
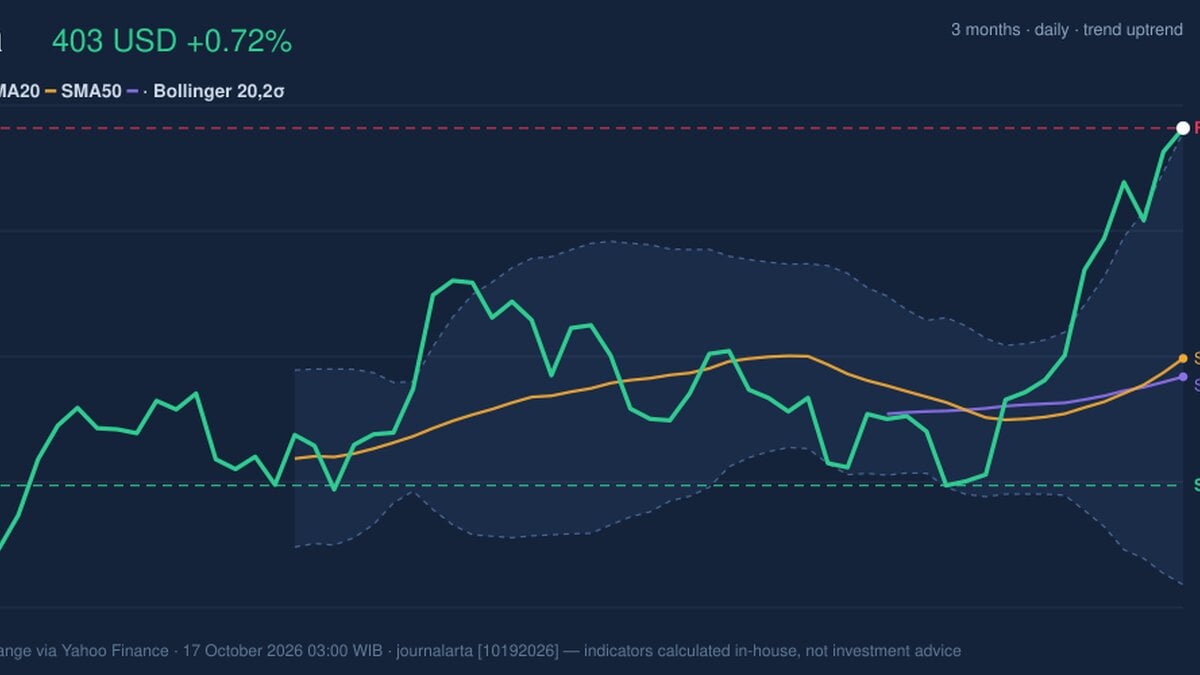
Visa closed at $402.61 on October 16, up 0.72% from the previous close, according to exchange data via Yahoo Finance. The payment network ended at its highest level in the past 20 trading days and near its three-month high of $404.74. That strength comes with a tension: the trend is advancing, but several momentum measures say the climb is stretched.
Why Visa is in focus today
- Closed at a 20-day high (402.61)
- Trading near its 3-month high (404.74)
- Fresh golden cross: SMA20 crossed above SMA50
- RSI(14) at 73.6 — overbought zone
- Uptrend confirmed (5-day change 4.45%)
Selected automatically from 30 NYSE (US) stocks by a technical-signal score with daily weighted randomisation — not a recommendation.
Trend & Price Action
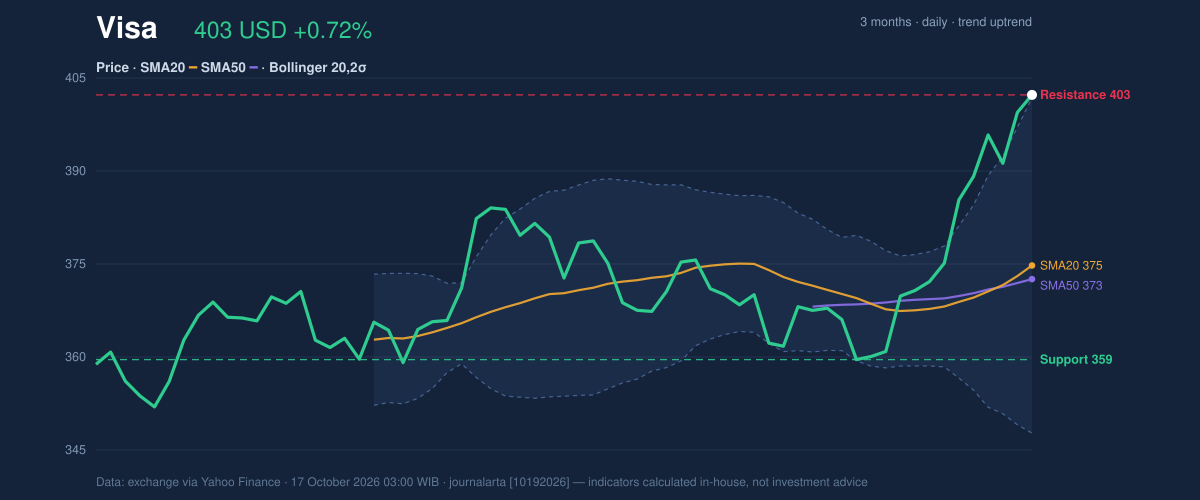
The share price has risen 4.45% in five trading days and 9.32% over one month. It sits above both its 20-day simple moving average, or SMA, at $374.72 and its 50-day SMA at $372.50. The shorter average has recently crossed above the longer one, a golden cross that suggests recent price strength is gaining ground over the medium-term trend. The 20-day average is also rising, with its slope up 1.61% over five days.
That structure is constructive, but the latest close was also at the top of the 20-day range and at the stated 20-day resistance of $402.61. A close above the upper Bollinger Band—$402.12—puts the price at 101% of the band’s range. Bollinger Bands track a moving average and its variability; a reading above the upper band signals an unusually strong move relative to recent trading, not proof that it must reverse. The band width is 14.6%, described as normal, so the data do not indicate a volatility squeeze.
As shown in the chart, Visa is trading well above its moving averages and pressing the upper boundary, while the marked resistance lies close to the three-month peak. That makes follow-through significant: holding near this area would show demand absorbing gains, while a retreat would test whether the recent breakout is losing momentum.
Oscillators & Momentum
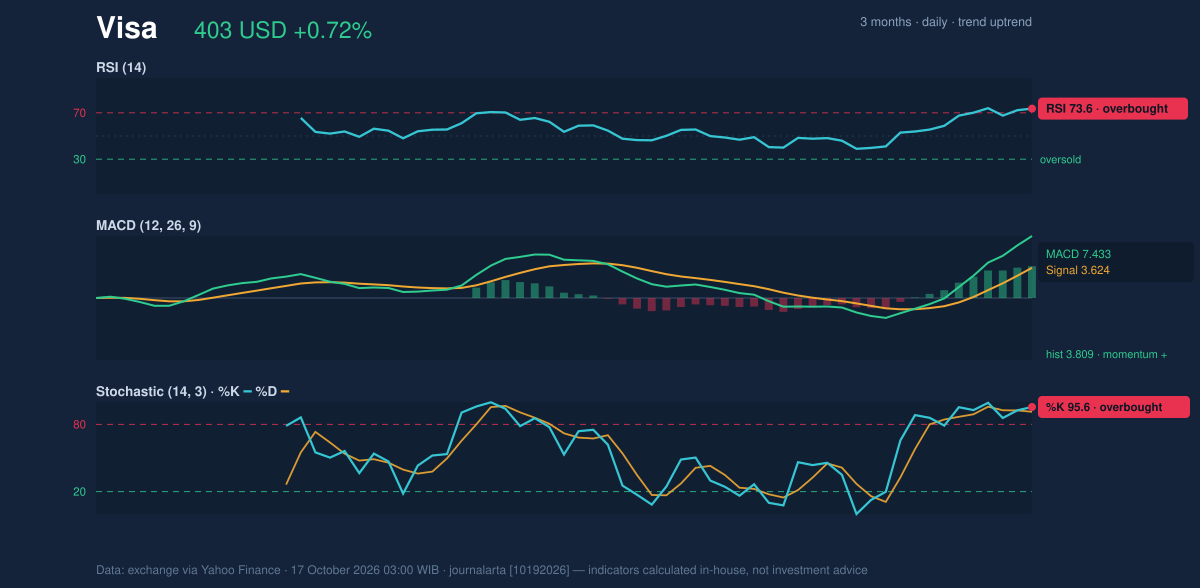
Momentum confirms the broader uptrend, though it also highlights near-term heat. The RSI is 73.6, in overbought territory; the Stochastic readings are similarly elevated, with %K at 95.6 and %D at 91.3. These indicators measure the speed and location of recent price moves. High readings can persist in a strong trend, but they increase the chance that further gains will be interrupted by consolidation or a pullback.
MACD remains positive: its reading of 7.433 is above the 3.624 signal line, leaving a positive histogram of 3.809. This supports the view that upward momentum is still active rather than already having rolled over. The key distinction is that positive MACD speaks to trend direction, while elevated RSI and Stochastic readings warn that the pace may be difficult to sustain without pauses.
Volatility, Volume & Levels
Trading volume was 6.78 million shares, about 1.1 times the 20-day average of 5,946,975, and on-balance volume, or OBV, is rising. OBV adds volume on advancing sessions and subtracts it on declining ones; its upward direction suggests participation is broadly consistent with the price advance. The volume signal is supportive, although the margin over average is modest rather than an exceptional surge.
Average True Range, a gauge of typical daily movement, is $7.16, or 1.8% of the share price, indicating moderate volatility. The nearest stated resistance is $402.61, with the three-month high at $404.74. The 20-day support is $359.33, while the moving averages around $373-$375 offer nearer reference points for assessing whether a pullback remains within the rising structure. A move above the three-month high would extend the advance; failure to hold the moving-average area would weaken the trend picture, with a break below $359.33 a clearer invalidation of this technical setup.
Technical Verdict: HOLD (wait & see)
Visa’s technical picture is upward but overheated, making confirmation near resistance more important than the recent gains alone. The golden cross and rising SMA20 support the trend; positive MACD and rising OBV add confirmation. Against that, RSI and Stochastic are overbought, and price is above the upper Bollinger Band at resistance. The verdict is invalidated if the price falls below $359.33.
- Ideal entry range: $374.72-$402.12, using the SMA20 and upper Bollinger Band as reference levels rather than as a forecast.
- Exit target: $404.74, the three-month high and nearby price ceiling in the data.
- Stop-loss protection: $359.33, the 20-day support level used for the verdict’s invalidation condition.
In plain English, the trend is strong, but the price is stretched enough that waiting for clearer confirmation may be more balanced than chasing the move.
Data: exchange figures via Yahoo Finance, as of October 17, 2026, 03:00 WIB. Technical analysis only; not an investment recommendation.
Summary Data Visa
| Last price | 402.61 USD |
| Change 1 day / 5 days / 1 month | 0.72% / 4.45% / 9.32% |
| Trend / MA-cross | uptrend / golden |
| SMA20 / SMA50 | 374.72 / 372.50 |
| RSI (14) / Stochastic %K | 73.6 / 95.6 |
| Bollinger %B / ATR | 101% / 7.16 |
| Support / Resistance 20 days | 359.33 / 402.61 |
| Data as of | 17 October 2026 03:00 WIB |
Disclaimer: This technical analysis is generated automatically from exchange data (via Yahoo Finance) and indicators calculated by JournalArta, for information and education only. The verdict and the entry, target and stop-loss levels are not investment advice or a solicitation to buy or sell any security. Investment decisions and their risks rest solely with the reader.
Track Visa stock price daily: live levels, support/resistance and our full Visa analysis history.