PG RSI Overbought: Stock Gains 1.45% (October 16, 2026)
On October 16, 2026: price 159.35 USD, trend uptrend, RSI 75.1, support 143.95, resistance 159.35. technical analysis of pg stock. PG RSI Overbought — full…
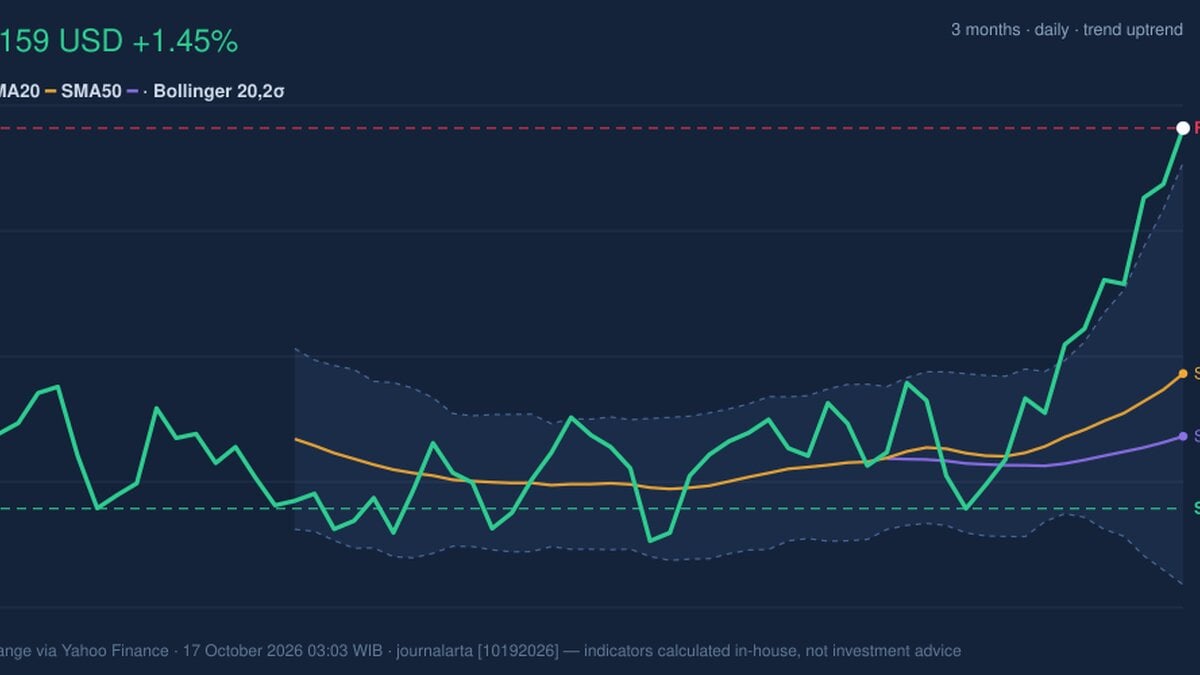
Why PG is in focus today
- Volume at 1.6× the 20-day average
- Trading near its 3-month high (159.98)
- RSI(14) at 75.1 — overbought zone
- Uptrend confirmed (5-day change 5.37%)
Selected automatically from 30 NYSE (US) stocks by a technical-signal score with daily weighted randomisation — not a recommendation.
Trend & Price Action
PG’s short-term trend is upward. The share price is above its 20-day simple moving average (SMA) of $149.41, while the 20-day average is above the 50-day SMA of $146.87. The 20-day average is rising at a 1.54% slope over five days, adding evidence that the trend is firming. There has been no new moving-average crossover, however; the signal comes from the current alignment and slope, not a fresh technical turning point. The price has moved above the upper Bollinger Band at $157.96, with %B at 108%. Bollinger Bands measure how far a price has moved relative to its recent range; a reading above 100% means it is beyond the upper band. That can accompany a strong breakout, but it also warns that the advance is extended. The band width is 11.4%, classified as normal, so the data do not point to an unusually compressed setup that is suddenly releasing volatility. PG is trending higher, but the close above the upper band and proximity to resistance make follow-through harder to take for granted.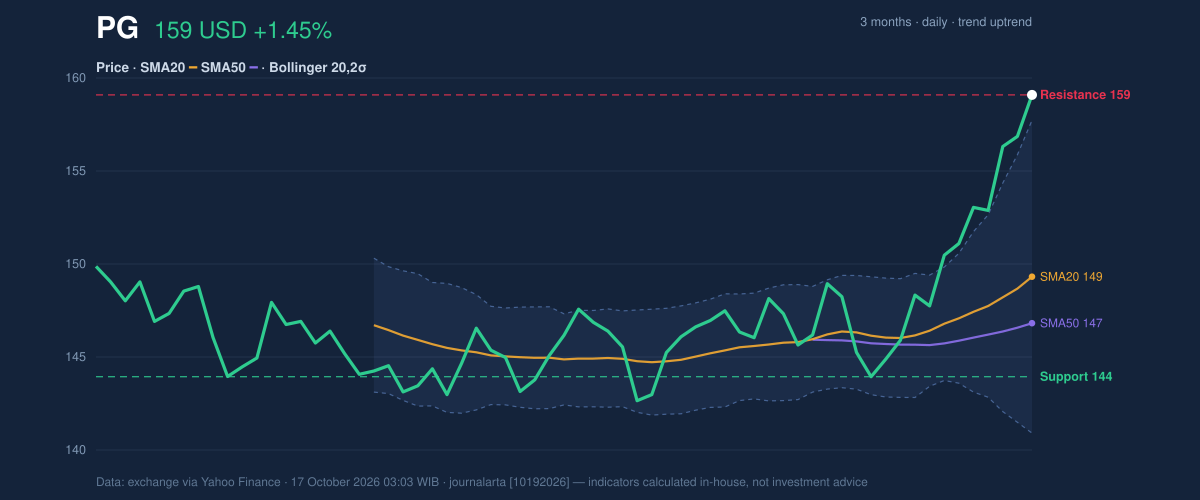
Oscillators & Momentum
The momentum indicators reinforce the uptrend while highlighting its near-term risk. The relative strength index (RSI), which gauges the pace of recent gains and losses, is 75.1, in overbought territory. The Stochastic oscillator is also elevated: %K is 96.2 and %D is 92.7. These readings do not, by themselves, predict a reversal. They do show that the advance has been rapid enough to leave the stock vulnerable to a pause or pullback. RSI at 75.1 and Stochastic at 96.2/92.7 are overbought signals, not proof that the trend has ended. The moving average convergence divergence (MACD) remains positive: its reading of 2.770 is above the 1.544 signal line, with a positive 1.226 histogram. In plain terms, the MACD still shows upward momentum, even as the faster oscillators warn that the pace may be difficult to sustain.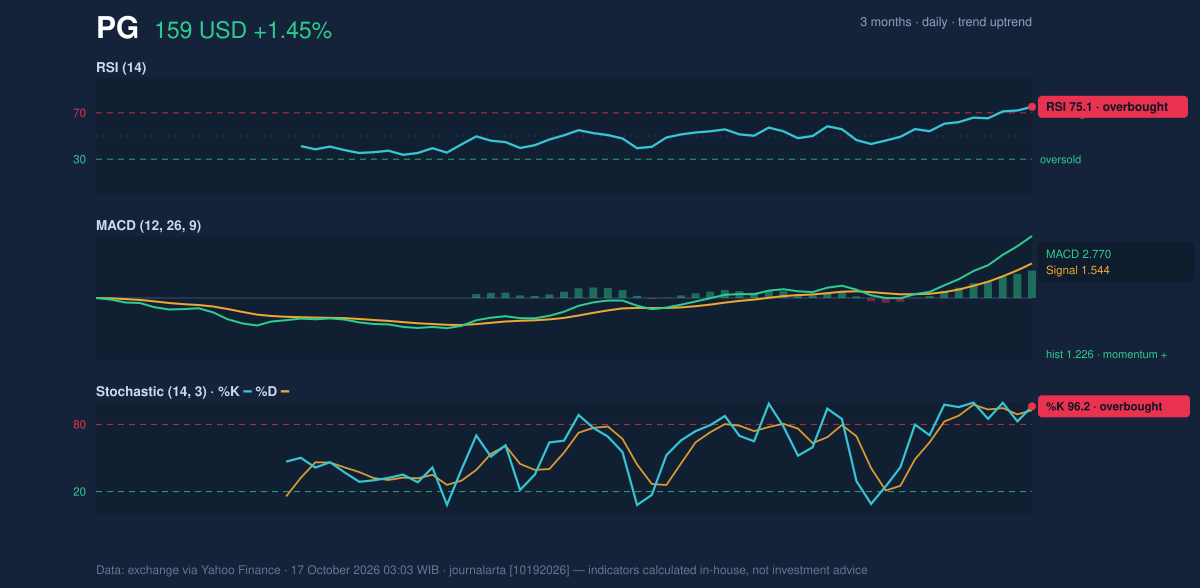
Volatility, Volume & Key Levels
Average true range (ATR), a measure of typical price movement, is $2.64, or 1.7% of the share price—moderate volatility by the supplied data. That matters because a retreat from the current level would not automatically signal a change in trend; ordinary price fluctuations can be meaningful when the stock is this close to resistance. The 20-day resistance is $159.35, equal to the latest price, while the three-month high is $159.98. The 20-day support is $143.95, and the three-month low is $140.20. If PG holds above the current resistance area and moves through the three-month high, it would show that buyers can extend the breakout. If it fails there, a retreat toward the rising SMA20 at $149.41 would be consistent with a cooling rally; a break below the $143.95 support would weaken the technical picture more clearly. The immediate test is whether trading can sustain a move beyond $159.35–$159.98; failure to do so leaves the $149.41 SMA20 as a nearer reference.Technical Verdict: HOLD (wait & see)
The indicators show a confirmed rising trend, but the entry point is complicated by an overbought RSI and Stochastic, plus a price above the upper Bollinger Band at resistance. Rising OBV and a positive MACD argue against treating the setup as an outright trend failure. The verdict is invalidated if PG falls below the $143.95 support. - Ideal entry range: $149.41–$157.96, bounded by the SMA20 and upper Bollinger Band. - Exit target: $159.98, the three-month high and the nearest stated level above resistance. - Stop-loss protection: $143.95, the 20-day support. For non-traders, the signals show a strong climb, but the price is testing resistance while short-term momentum is unusually hot.| Indicator | Reading |
|---|---|
| Last price | $159.35 |
| SMA20 / SMA50 | $149.41 / $146.87 |
| RSI(14) | 75.1 — overbought |
| Stochastic %K / %D | 96.2 / 92.7 — overbought |
| MACD / signal / histogram | 2.770 / 1.544 / 1.226 |
| Support / resistance (20-day) | $143.95 / $159.35 |
| ATR(14) | $2.64 |
Summary Data PG
| Last price | 159.35 USD |
| Change 1 day / 5 days / 1 month | 1.45% / 5.37% / 8.85% |
| Trend / MA-cross | uptrend / none |
| SMA20 / SMA50 | 149.41 / 146.87 |
| RSI (14) / Stochastic %K | 75.1 / 96.2 |
| Bollinger %B / ATR | 108% / 2.64 |
| Support / Resistance 20 days | 143.95 / 159.35 |
| Data as of | 17 October 2026 03:03 WIB |
Disclaimer: This technical analysis is generated automatically from exchange data (via Yahoo Finance) and indicators calculated by JournalArta, for information and education only. The verdict and the entry, target and stop-loss levels are not investment advice or a solicitation to buy or sell any security. Investment decisions and their risks rest solely with the reader.
Track PG stock price daily: live levels, support/resistance and our full PG analysis history.