Oracle (ORCL) Stock Falls 1.51% on Tuesday, Momentum Weakens
Technical analysis of ORCL stock on November 10, 2026: price 117.98 USD, trend downtrend, RSI 40.7, support 115.16, resistance 144.54.

Why ORCL is in focus today
- Downtrend extending (5-day change -6.51%)
Selected automatically from 80 NYSE (US) stocks by a technical-signal score with daily weighted randomisation — not a recommendation.
Trend & Price Action
Oracle is below both its 20-day moving average of $127.22 and its 50-day average of $137.87. The 20-day average has fallen 4.09% over five days, a sign that the near-term trend is weakening rather than simply reflecting one bad session. No new moving-average crossover has formed. The stock is near the bottom of its recent trading range: it sits in the lower 10% of its 20-day range, between support at $115.16 and resistance at $144.54. It also remains above its three-month low of $109.21, but well below the three-month high of $170.70. As shown in the chart, the relationship between price and the declining averages is more consistent with pressure on rebounds than with a confirmed recovery.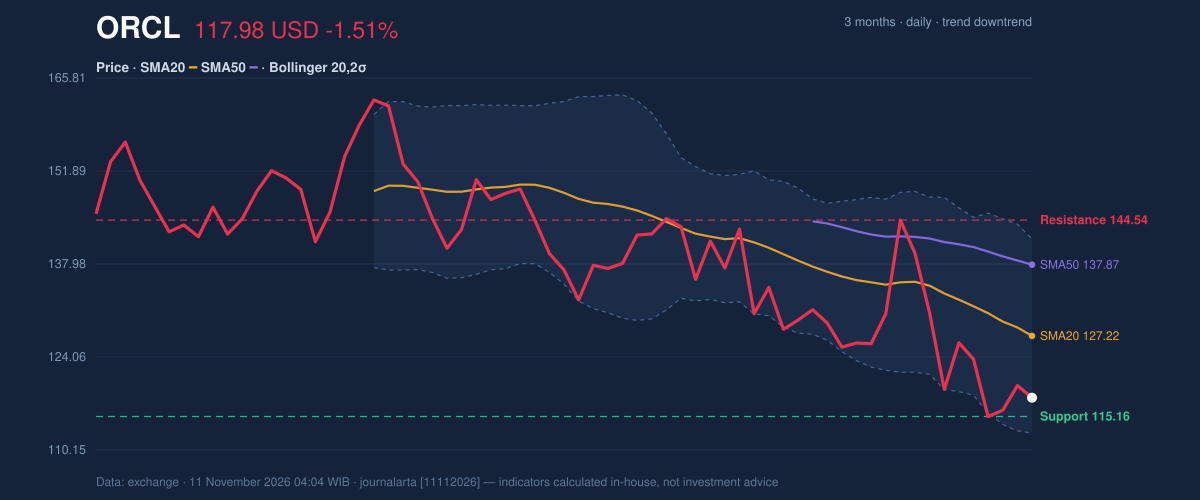
Oscillators & Momentum
The indicators are weak, though not uniformly at extremes. RSI is 40.7, in the neutral zone, below the level that would typically signal stronger momentum but not in oversold territory. Stochastic %K and %D are both 22.3 and classified as neutral in the data; their low readings point to subdued momentum, not by themselves a reliable turning signal. MACD is negative at -5.393, below its -4.442 signal line, with a -0.951 histogram. The configuration indicates bearish momentum: the faster-moving measure remains weaker than its signal, and the negative histogram shows that gap is still on the downside. The indicators therefore do not yet confirm a price reversal.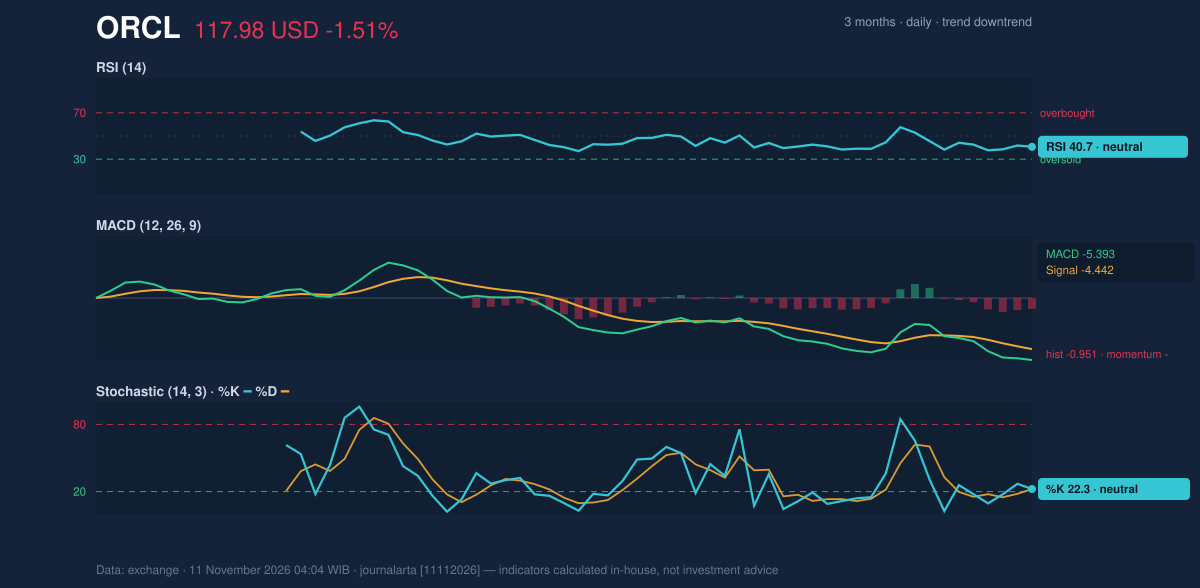
Volatility & Volume
Oracle’s Bollinger Bands are widening, with a 22.9% band width, indicating elevated volatility. Price is at 18% of the band range and nearer the lower band at $112.68 than the upper band at $141.75. That location reflects persistent selling pressure, although it does not guarantee the shares will continue lower. The 14-day average true range, a measure of typical price movement, is $8.71, or 7.4% of the share price. In practical terms, daily swings are large relative to the current price, which makes nearby technical levels especially important. The latest volume was 23,189,700, about half the 20-day average of 43,716,675, while OBV—the running measure of buying and selling volume—was falling. Thin volume means the latest decline had limited participation, but the falling OBV supports the broader downtrend rather than showing accumulation.Key Levels & Scenarios
The first test is support at $115.16. A break below that level would put the three-month low of $109.21 in view as the next reference point. If support holds, the price would still need to recover the 20-day average at $127.22 before the chart offers stronger evidence of improving short-term structure. Resistance at $144.54 remains a more distant hurdle. The wider bands and elevated ATR leave room for sharp moves in either direction. But with price below both moving averages, MACD negative and OBV falling, a rebound alone would not establish that the downtrend has ended.Fundamental Context
The technical weakness contrasts with the company’s latest reported results. According to its SEC filing, Oracle reported quarterly revenue of $19.35 billion for the quarter ended August 31, 2026, up 29.6% from $14.93 billion a year earlier. Net income was $4.76 billion, compared with $2.93 billion, and diluted earnings per share were $1.56. Oracle also filed a Form 8-K with the SEC on November 4 reporting other material events. These company disclosures provide context, but the verdict below is driven by the share-price indicators.Technical Verdict: HOLD (wait & see)
HOLD (wait & see) reflects three technical pressures: the price is below its 50-day average, the trend is down and the 20-day average is below the 50-day average. RSI at 40.7 remains in the 30–50 zone, while the stock has dropped 6.51% in five sessions. The research signal count is zero bullish versus two bearish. The verdict is invalidated if price breaks below $115.16. - Conditional entry range: $144.54–$170.70, only in the upside scenario after a close above the 20-day resistance at $144.54; the upper level is the three-month high. - Exit target: $170.70 in that upside scenario. - Stop-loss reference: $115.16, the 20-day support; a break below it defines the downside scenario. For non-traders, the signals remain weak, and the chart has not yet shown a convincing change in direction.Summary Data ORCL
| Last price | 117.98 USD |
| Change 1 day / 5 days / 1 month | -1.51% / -6.51% / -17.61% |
| Trend / MA-cross | downtrend / none |
| SMA20 / SMA50 | 127.22 / 137.87 |
| RSI (14) / Stochastic %K | 40.7 / 22.3 |
| Bollinger %B / ATR | 18% / 8.71 |
| Support / Resistance 20 days | 115.16 / 144.54 |
| Data as of | 11 November 2026 04:04 WIB |
| JournalArta research verdict (score) | Hold (-76) |
Today's full Buy and Sell list for US stocks →
Disclaimer: This technical analysis is generated automatically from exchange data and indicators calculated by JournalArta, for information and education only. The verdict and the entry, target and stop-loss levels are not investment advice or a solicitation to buy or sell any security. Investment decisions and their risks rest solely with the reader.
Track ORCL stock price daily: live levels, support/resistance and our full ORCL analysis history.