AbbVie (ABBV) Stock Analysis: Rises 0.20%, Testing Key Resistance
Technical analysis of ABBV stock on November 10, 2026: price 293.89 USD, trend uptrend, RSI 62.0, support 282.68, resistance 294.89.
Why ABBV is in focus today
- Uptrend confirmed (5-day change 2.76%)
Selected automatically from 80 NYSE (US) stocks by a technical-signal score with daily weighted randomisation — not a recommendation.
Trend & Price Action
AbbVie’s price remains above both its 20-day simple moving average (SMA), at $288.04, and its 50-day average, at $273.45. A simple moving average smooths daily price fluctuations to show the prevailing direction. The 20-day average rose 1.51% over five days, reinforcing the uptrend, while no new moving-average crossover occurred. In other words, the trend is established rather than newly confirmed by a crossover. The stock is at 92% of its 20-day trading range, with support at $282.68 and resistance at $294.89. That positioning leaves limited room before the nearby ceiling: a sustained move above resistance would signal that buyers are extending the advance, while a retreat toward support would test whether the trend can absorb profit-taking. The three-month high of $302.93 is a broader reference point, not a guarantee of further gains. The trend is rising, but the share price is pressing against resistance rather than starting from a low-risk position. As shown in the chart, the price sits above its moving averages while approaching the upper end of its recent range.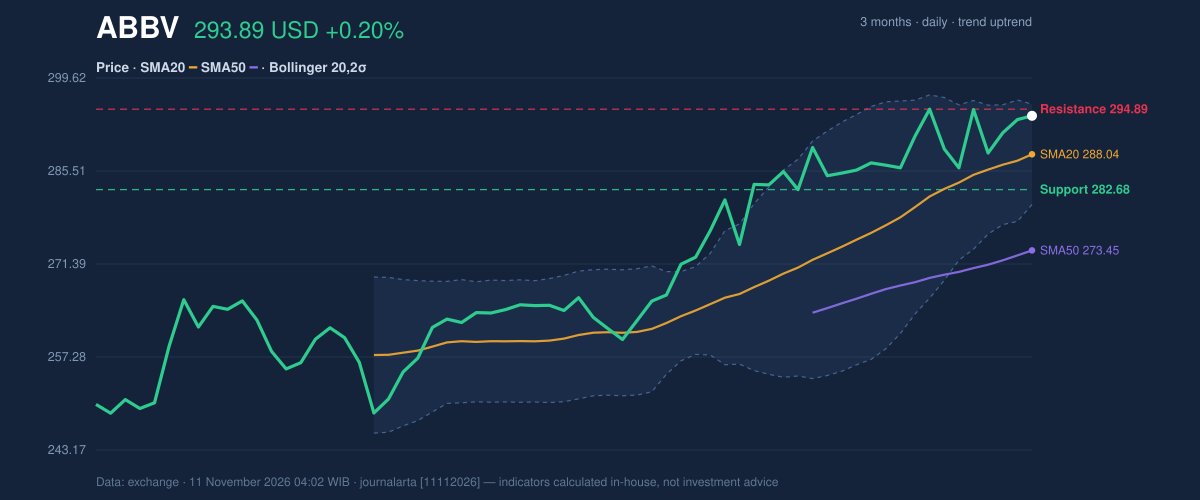
Oscillators & Momentum
Momentum indicators are positive but not unanimous. The RSI is 62.0, in the neutral zone; the Relative Strength Index gauges the pace of recent gains, and this reading is consistent with an advance that has not reached an overbought extreme. The Stochastic readings are also neutral, with %K at 63.7 and %D at 59.5. This oscillator compares a closing price with its recent range, and the two readings do not yet indicate an extreme. The MACD tells a more cautious story. Its value is 5.481, below the 5.765 signal line, leaving a negative histogram of -0.284. That points to weakening short-term momentum, not necessarily a reversal of the broader trend. A separate technical signal flags the RSI as rolling over from above 65, adding to the case for watching whether the price can hold its gains. The indicators are not moving in lockstep.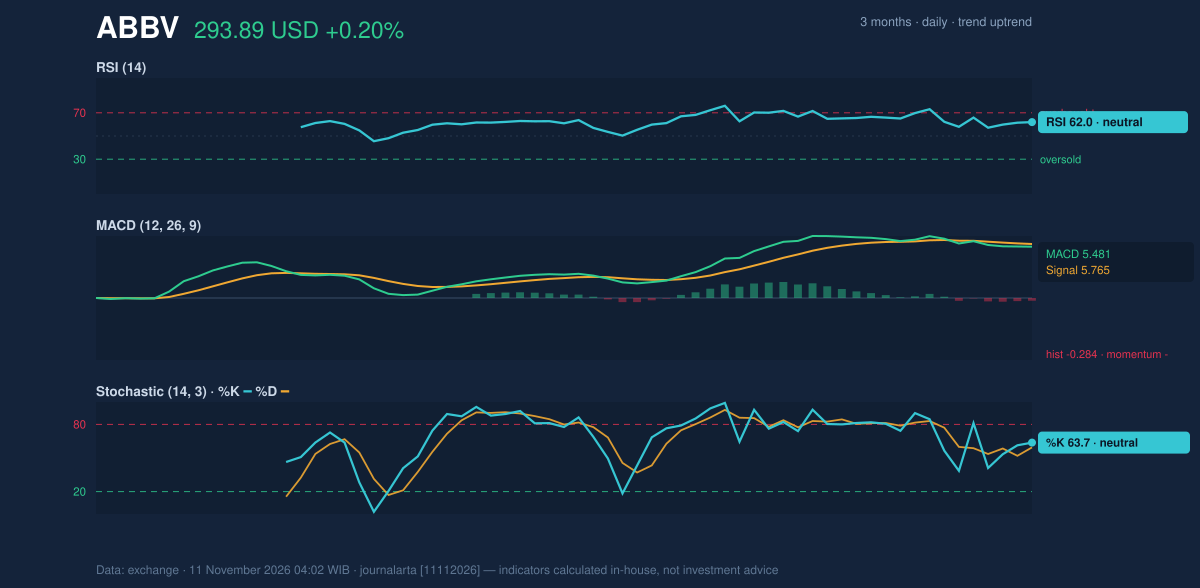
Volatility & Volume
AbbVie’s Bollinger Bands are narrowing, a condition often called a squeeze: the band width is 5.3%, with the price at 88% of the range between the bands. The upper band is $295.66 and the lower band is $280.43. A squeeze signals that recent price swings have contracted and that a larger move may follow, but it does not reveal which direction that move will take. The price’s proximity to the upper band makes a breakout possible, while the weaker MACD cautions against treating it as confirmed. The 14-day Average True Range, a measure of typical daily movement, is $7.49, or 2.5% of the share price, indicating moderate volatility. Volume was 3,520,100 shares, only 0.6 times the 20-day average of 5,536,025. That thin activity means the latest advance had less participation than usual. On the other hand, rising On-Balance Volume (OBV), which tracks whether volume generally flows into or out of a stock, supports the longer trend.Fundamental Context
The technical picture sits alongside stronger reported results. According to its SEC filing, AbbVie reported quarterly revenue of $17.40 billion for the quarter ended September 30, 2026, up 10.3% from $15.78 billion a year earlier. Net income was $4.22 billion, compared with $186.0 million a year earlier, and diluted earnings per share were $2.37. The company also filed an 8-K on November 2 reporting a change of directors or officers; these filings provide context, but do not settle the near-term price signals.Technical Verdict: BUY
JournalArta’s technical score is +68 on a scale from −100 to +100, meeting its stated threshold for this call. The strongest supporting signals are the price above its 50-day average, the 20-day average above the 50-day, and rising OBV in an uptrend. RSI at 62.0 remains within the 50–70 zone. The counterweight is the negative MACD histogram and the RSI rollover signal. BUY is the required technical verdict; it would be invalidated if the price falls below the specified stop-loss level of $281.14. - Ideal entry range: $288.27–$293.89 - Exit targets: $313.01 (target 1) and $332.14 (target 2) - Stop-loss protection: $281.14 - The stated reward-to-risk figures are 1.5 and 3.0; the verdict is valid until December 9, 2026. In plain English, the technical setup favors the rising trend, but weakening short-term momentum makes the stated risk level important.Summary Data ABBV
| Last price | 293.89 USD |
| Change 1 day / 5 days / 1 month | 0.20% / 2.76% / 7.12% |
| Trend / MA-cross | uptrend / none |
| SMA20 / SMA50 | 288.04 / 273.45 |
| RSI (14) / Stochastic %K | 62.0 / 63.7 |
| Bollinger %B / ATR | 88% / 7.49 |
| Support / Resistance 20 days | 282.68 / 294.89 |
| Data as of | 11 November 2026 04:02 WIB |
| JournalArta research verdict (score) | Buy (+68) |
| Entry zone | 288.27 – 293.89 |
| Target 1 / 2 | 313.01 / 332.14 |
| Stop loss | 281.14 |
| Reward/risk | 1.5 / 3.0 |
Today's full Buy and Sell list for US stocks →
Disclaimer: This technical analysis is generated automatically from exchange data and indicators calculated by JournalArta, for information and education only. The verdict and the entry, target and stop-loss levels are not investment advice or a solicitation to buy or sell any security. Investment decisions and their risks rest solely with the reader.
Track ABBV stock price daily: live levels, support/resistance and our full ABBV analysis history.