Apple (AAPL) Stock Analysis: Falls 0.62%, Testing Key Resistance
Technical analysis of AAPL stock on November 10, 2026: price 348.51 USD, trend uptrend, RSI 55.8, support 331.90, resistance 350.69.

Why AAPL is in focus today
- Trading near its 3-month high (355.38)
- Uptrend confirmed (5-day change 5.00%)
Selected automatically from 100 NASDAQ (US) stocks by a technical-signal score with daily weighted randomisation — not a recommendation.
Trend & Price Action
Apple remains above both its 20-day moving average of $344.23 and its 50-day average of $337.27, a structure consistent with an uptrend. The 20-day average rose 0.57% over five days, while the absence of a new moving-average crossover suggests the trend has persisted rather than just turned. The shares are near the top of their three-month range: the high is $355.38, and the low is $300.57. The price sits at 88% of its 20-day range, between support at $331.90 and resistance at $350.69. That position leaves limited room before the nearby ceiling, so a sustained move above resistance would matter more than another small gain within the range. A retreat toward the moving averages, by contrast, would test whether the trend has support beyond recent price momentum.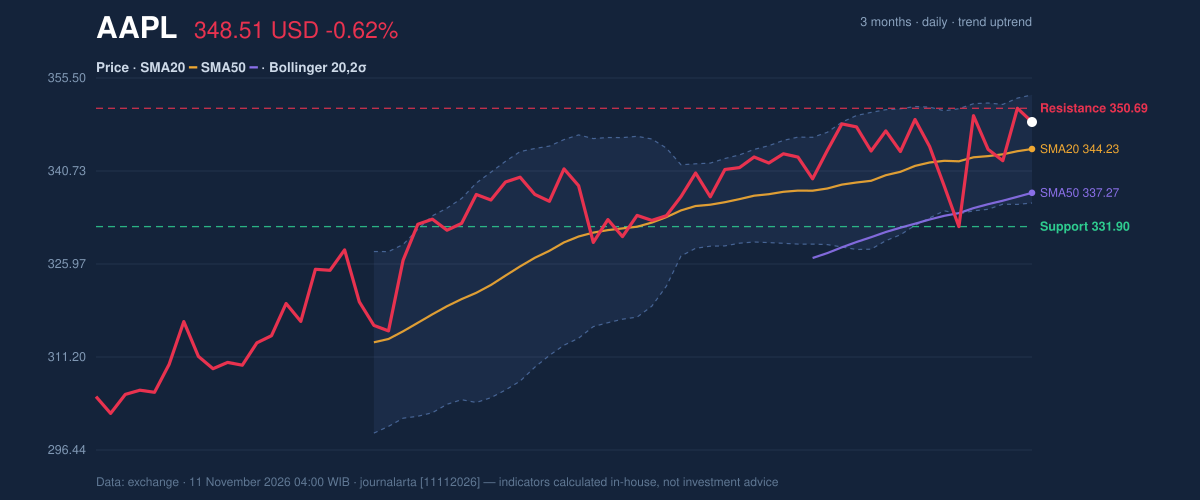
Oscillators & Momentum
The momentum readings are mixed rather than uniformly bullish. The RSI is 55.8, a neutral reading that places Apple in neither an overbought nor oversold condition. The Stochastic is also neutral, with %K at 77.1 and %D at 72.7; its elevated readings show recent strength, but the classification does not confirm a decisive momentum surge. The MACD histogram is negative at -0.101, with MACD at 2.765 below its 2.867 signal line. That divergence from the broader rising trend points to fading short-term momentum, not necessarily a reversal. It makes follow-through above resistance a key test.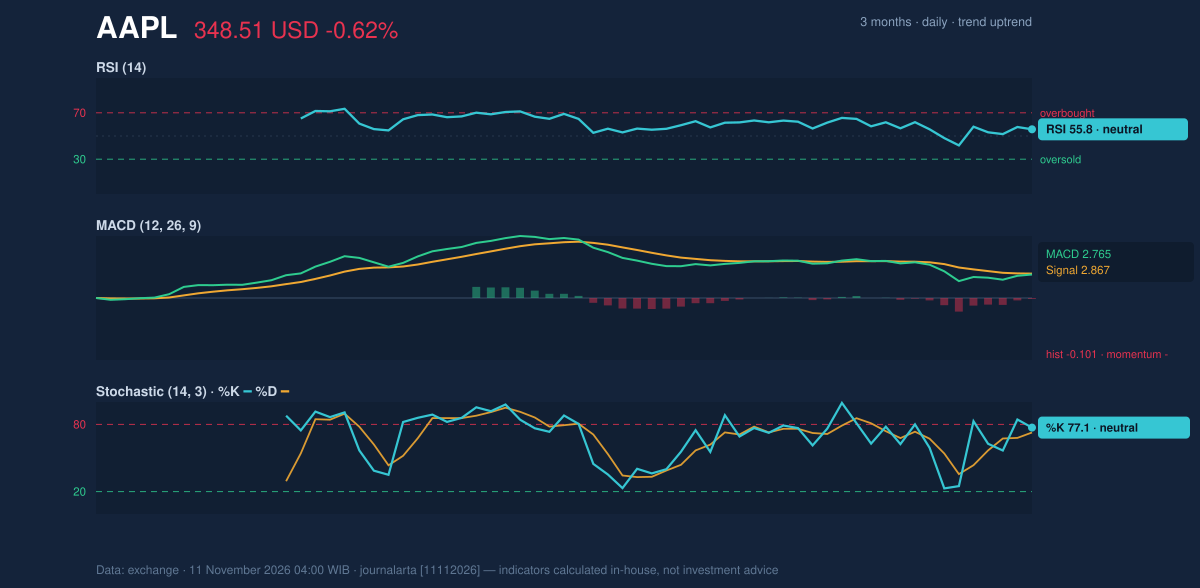
Volatility & Volume
Apple’s Bollinger Bands are narrowing, with a 5.0% width and the price at 75% of the band range. A squeeze—when the bands contract—signals that recent volatility has eased and that a larger move may follow, but it does not say which direction that move will take. The upper band at $352.82 is close to resistance, while the lower band is $335.65. Average true range, a measure of typical price movement, is $9.49, or 2.7% of the share price, indicating moderate volatility. Participation was comparatively light: volume of 29,718,200 was 0.6 times the 20-day average of 49,376,375. On-balance volume (OBV), which tracks whether volume is flowing more strongly on rising or falling days, was also down. Together, thin volume and falling OBV temper the significance of the five-day gain.Key Levels & Scenarios
A hold above the 20-day average would support the current upward structure; a move through $350.69 resistance would put the three-month high of $355.38 in focus. Failure to hold the moving averages would shift attention to $331.90 support. The narrowing Bollinger Bands and weak volume make confirmation important: a breakout without stronger participation could be less persuasive.Fundamental Context
According to its SEC filing, Apple reported fiscal-year revenue of $478.83 billion for the year ended September 26, 2026, up 15.1% from $416.16 billion a year earlier. Net income was $132.18 billion, compared with $112.01 billion, and diluted earnings per share were $8.98. Apple also filed a Form 8-K on November 9 reporting other material events.Technical Verdict: BUY
The JournalArta Research verdict is BUY, supported by the share price above its 50-day average, the 20-day average above the 50-day average, and an uptrend with RSI at 55.8. The counterweight is short-term: the MACD histogram is negative and volume is below average. The verdict is invalidated if the price falls below $330.00. - Ideal entry range: $341.41–$348.51 - Exit targets: $376.27 (Target 1) and $404.04 (Target 2) - Stop-loss protection: $330.00 - Validity: through December 9, 2026 For non-traders, the technical setup is positive under the stated levels, but weaker momentum and light trading make confirmation less certain.| Indicator | Reading |
|---|---|
| Last price | $348.51 |
| Daily / five-day / one-month change | -0.62% / +5.00% / +2.12% |
| SMA20 / SMA50 | $344.23 / $337.27 |
| RSI / MACD histogram | 55.8 / -0.101 |
| 20-day support / resistance | $331.90 / $350.69 |
| Volume / 20-day average | 29,718,200 / 49,376,375 |
Summary Data AAPL
| Last price | 348.51 USD |
| Change 1 day / 5 days / 1 month | -0.62% / 5.00% / 2.12% |
| Trend / MA-cross | uptrend / none |
| SMA20 / SMA50 | 344.23 / 337.27 |
| RSI (14) / Stochastic %K | 55.8 / 77.1 |
| Bollinger %B / ATR | 75% / 9.49 |
| Support / Resistance 20 days | 331.90 / 350.69 |
| Data as of | 11 November 2026 04:00 WIB |
| JournalArta research verdict (score) | Buy (+68) |
| Entry zone | 341.41 – 348.51 |
| Target 1 / 2 | 376.27 / 404.04 |
| Stop loss | 330.00 |
| Reward/risk | 1.5 / 3.0 |
Today's full Buy and Sell list for US stocks →
Disclaimer: This technical analysis is generated automatically from exchange data and indicators calculated by JournalArta, for information and education only. The verdict and the entry, target and stop-loss levels are not investment advice or a solicitation to buy or sell any security. Investment decisions and their risks rest solely with the reader.
Track AAPL stock price daily: live levels, support/resistance and our full AAPL analysis history.