Micron Technology (MU) Stock Analysis: Falls 1.10%, Momentum Weakens
Technical analysis of MU stock on November 10, 2026: price 725.11 USD, trend downtrend, RSI 35.9, support 656.39, resistance 983.23.

Why MU is in focus today
- Downtrend extending (5-day change -15.20%)
Selected automatically from 100 NASDAQ (US) stocks by a technical-signal score with daily weighted randomisation — not a recommendation.
Trend & Price Action
The 20-day average stands at $854.81 and the 50-day at $952.97. The 20-day average fell 8.04% over five days, underscoring how quickly the near-term trend has deteriorated. There has been no new moving-average crossover, so the signal comes from the price’s position below both averages and their downward direction—not a newly formed technical event. MU sits in the lower part of its recent range, at 21% of the distance between the 20-day support and resistance levels. Its three-month low is $650.00, close to the $656.39 support area. This proximity matters: if support holds, it may mark a zone where selling pressure pauses; if it gives way, the stock would be testing its three-month low. As shown in the chart, the price remains well below the moving averages, while the Bollinger bands are wide.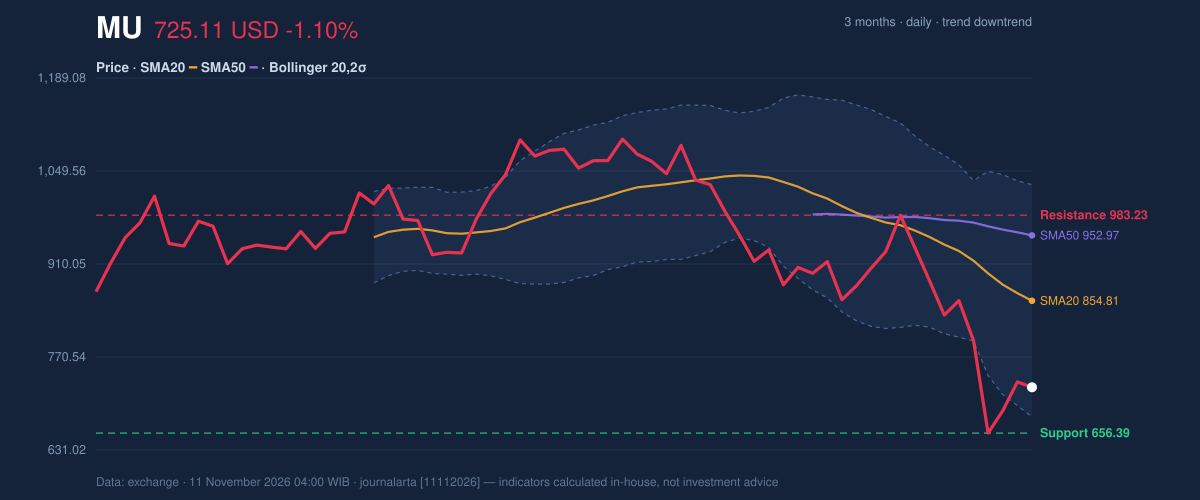
Oscillators & Momentum
The indicators show weakness, but not a uniform signal of capitulation. The RSI is 35.9, in the neutral zone, near—but not within—the commonly watched oversold area below 30. Stochastic %K at 22.1 and %D at 19.4 are also classified as neutral in the supplied data. A separate technical signal notes that RSI is rebounding from below 35, offering a limited counterpoint to the broader decline. The MACD is negative: its reading of -67.796 is below the -49.444 signal line, and the histogram is -18.352. That configuration indicates downward momentum remains dominant. Meanwhile, falling OBV—a measure that tracks whether trading volume is flowing into or out of a stock—confirms the downtrend rather than showing buyers quietly accumulating shares. The chart pairs those momentum readings with RSI and Stochastic, helping distinguish a possible short-term bounce from a broader reversal.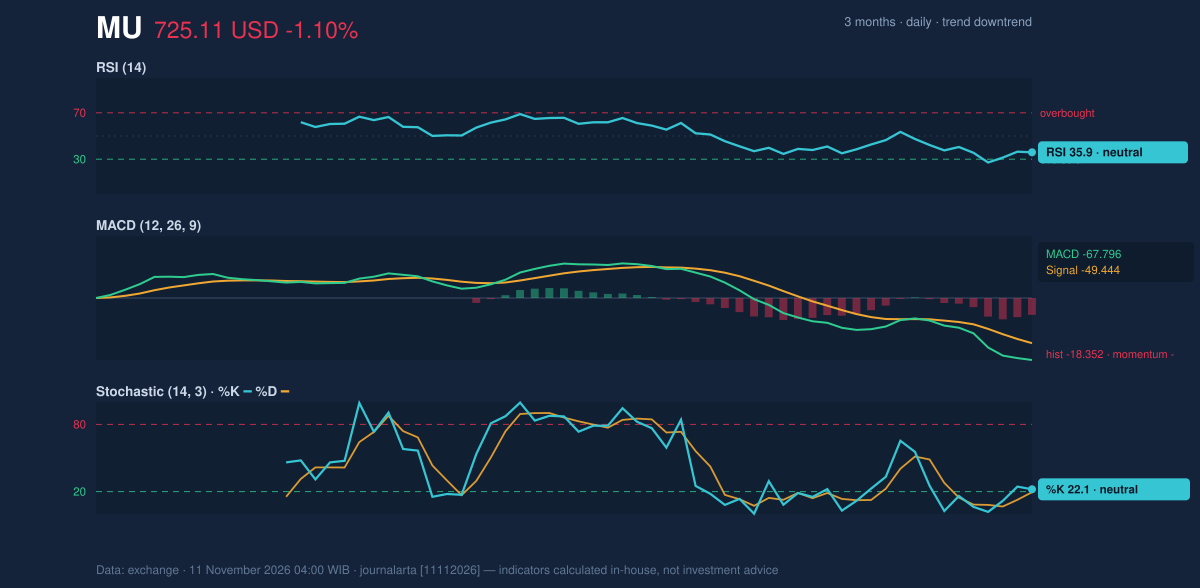
Volatility & Volume
The Bollinger reading places MU at just 13% of the band’s width, near the lower band at $680.54. The bands have widened to 40.8%, indicating heightened volatility rather than a tightly contained market. A low position within the bands can reflect sustained selling; by itself, it does not establish that a rebound is due. The 14-day ATR, a measure of typical price movement, is $60.62, or 8.4% of the share price. That is a large daily range in percentage terms, making nearby support and resistance conditional markers rather than precise boundaries. Latest volume was 28,215,100 shares, about 0.9 times the 20-day average. The decline therefore came without unusually heavy volume, but falling OBV still points to weakening participation from buyers.Fundamental Context
According to its SEC filing, Micron reported fiscal-year revenue of $133.19 billion for the year ended September 3, 2026, up 256.3% from $37.38 billion a year earlier. Net income was $84.97 billion, compared with $8.54 billion, and diluted earnings per share were $74.33. Those figures provide a striking contrast with the share-price decline, but company results and market direction measure different things: the filing records business performance over the fiscal year, while the technical signals reflect recent trading. Micron also reported a change of directors or officers in a Form 8-K filed November 5.Technical Verdict: HOLD (wait & see)
The prescribed technical call is HOLD (wait & see). The strongest reasons are that MU trades below both moving averages, the 20-day average is falling, and MACD and OBV reinforce the downtrend. RSI’s rebound from below 35 is a counter-signal, but it has not yet outweighed those pressures. The verdict is invalidated if price breaks below the $656.39 20-day support. The reference levels define conditional scenarios, not a forecast: - Entry range: $656.39–$725.11, only as a support-hold scenario; a break below support weakens that setup. - Exit target: $983.23, the 20-day resistance, in an upside scenario requiring a close above that level. - Stop-loss protection: $634.18, the reference level based on price minus 1.5 times ATR. For non-traders, HOLD means the chart has not yet shown enough evidence to resolve whether the decline will stabilize or continue.Summary Data MU
| Last price | 725.11 USD |
| Change 1 day / 5 days / 1 month | -1.10% / -15.20% / -23.93% |
| Trend / MA-cross | downtrend / none |
| SMA20 / SMA50 | 854.81 / 952.97 |
| RSI (14) / Stochastic %K | 35.9 / 22.1 |
| Bollinger %B / ATR | 13% / 60.62 |
| Support / Resistance 20 days | 656.39 / 983.23 |
| Data as of | 11 November 2026 04:00 WIB |
| JournalArta research verdict (score) | Hold (-60) |
Today's full Buy and Sell list for US stocks →
Disclaimer: This technical analysis is generated automatically from exchange data and indicators calculated by JournalArta, for information and education only. The verdict and the entry, target and stop-loss levels are not investment advice or a solicitation to buy or sell any security. Investment decisions and their risks rest solely with the reader.
Track MU stock price daily: live levels, support/resistance and our full MU analysis history.