CrowdStrike (CRWD) Stock Technicals: Falls 1.23% on Tuesday, Death Cross Pressure
Technical analysis of CRWD stock on November 10, 2026: price 225.76 USD, trend downtrend, RSI 41.0, support 216.90, resistance 268.02.

Why CRWD is in focus today
- Fresh death cross: SMA20 crossed below SMA50
- Downtrend extending (5-day change -7.73%)
Selected automatically from 100 NASDAQ (US) stocks by a technical-signal score with daily weighted randomisation — not a recommendation.
Trend & Price Action
CrowdStrike’s price is below its 20-day simple moving average (SMA), at $241.78, and its 50-day SMA, at $243.88. The 20-day average fell 3.94% over five days, showing that the weakness is reflected not only in the share price but also in its short-term trend. The death cross—when the 20-day average moves beneath the 50-day average—formed one session before the latest session. This is a bearish trend signal, not a same-session event. The shares lost 1.23% in one day and 13.57% over one month. At $225.76, the stock sits in the lower part of its 20-day range, with support at $216.90 and resistance at $268.02. Its three-month range is $181.24 to $286.99, showing that the recent decline has not taken it to the period’s low, but has moved it materially away from the high. The chart puts that structure in view.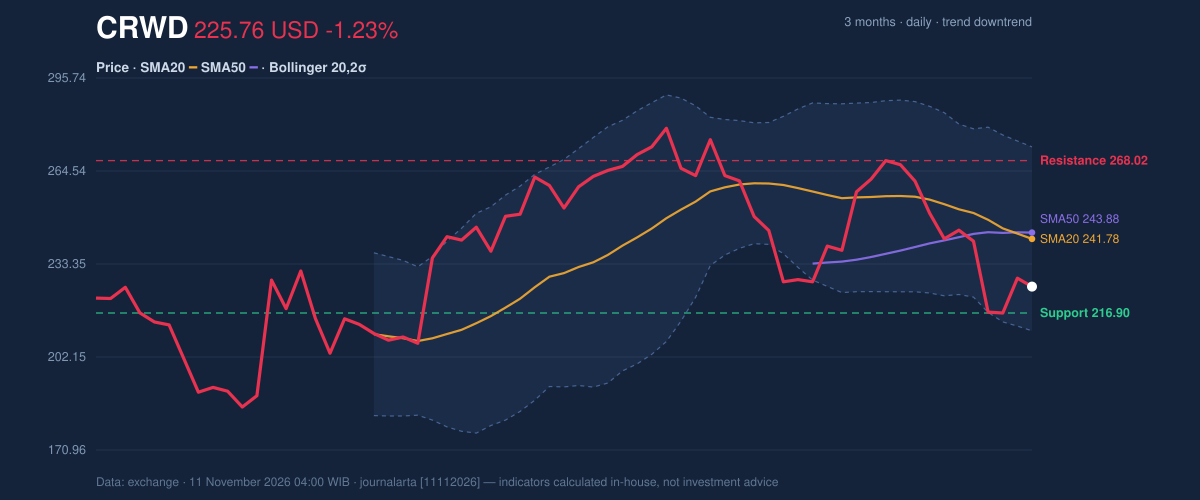
Oscillators & Momentum
The Relative Strength Index (RSI), a gauge of recent buying and selling pressure, is 41.0, a neutral reading rather than an extreme oversold signal. The Stochastic readings are also classified as neutral: %K is 21.2 and %D is 17.8. Neither oscillator currently confirms a decisive rebound. The Moving Average Convergence Divergence (MACD), which compares short- and longer-term price momentum, is more clearly negative: the MACD is -5.725, below its -2.015 signal line, with a -3.710 histogram. That indicates downside momentum remains in control. MACD is bearish, while RSI and Stochastic are neutral. The mix suggests selling pressure is established, but the indicators alone do not show an extreme reading that would settle the question of a near-term turn.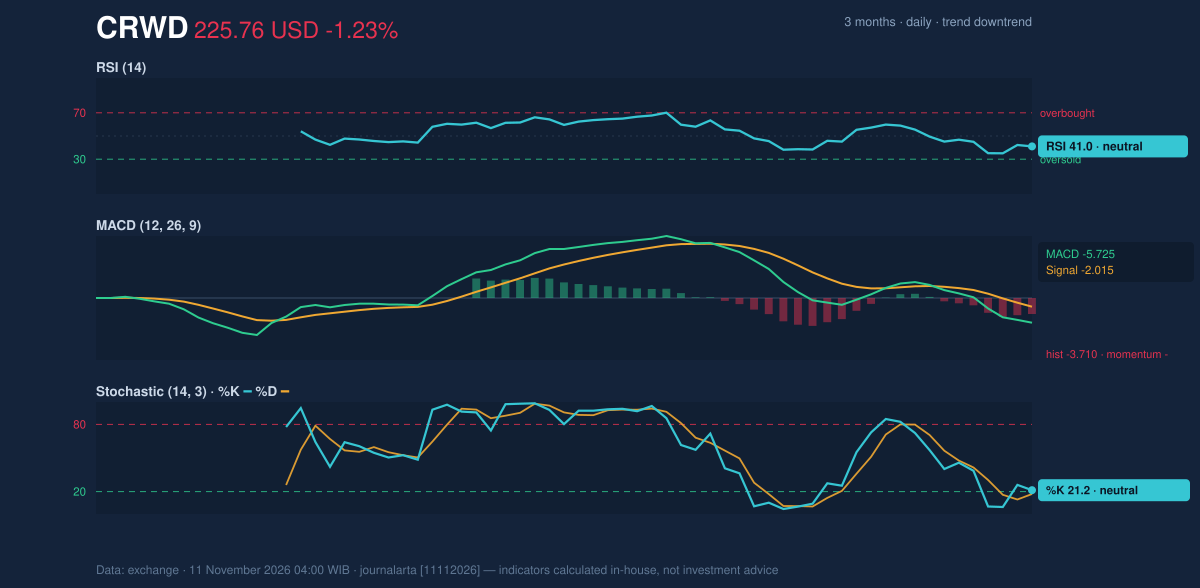
Volatility & Volume
The Bollinger Bands—bands that widen or narrow with price volatility—are widening, with a 25.5% band width. The stock’s %B reading is 24%, placing it closer to the lower band at $210.93 than the upper band at $272.63. Widening bands and a low %B reflect elevated volatility and a price near the lower end of its recent range. Average True Range (ATR), a measure of typical price movement, is $15.02, or 6.7% of the share price; the data classifies volatility as high. Volume was 6,191,000 shares, against a 20-session average of 9,822,780, while OBV was falling. The lighter volume does not erase the downtrend, but it means the latest session’s decline came with below-normal trading activity. Falling OBV, meanwhile, signals that cumulative buying and selling pressure remains weak.Fundamental Context
The technical picture contrasts with improving reported results. According to its SEC filing, CrowdStrike reported quarterly revenue of $1.47 billion for the quarter ended July 31, 2026, up 25.8% from $1.17 billion a year earlier. It posted net income of $5.3 million, compared with a net loss of $70.2 million a year earlier, and diluted earnings per share of $0.01. Those figures show revenue growth and a return to net income, but they do not change the bearish technical signals in the share price.Technical Verdict: SELL
JournalArta Research’s technical verdict is SELL, with a score of -84 on a scale from -100 to +100. The strongest reasons are the death cross, the share price below its 50-day average, and the falling OBV that confirms a downtrend. The verdict is invalidated if the price rises above the stated stop-loss level of $251.29. - Entry range: $225.76–$237.01 - Exit targets: $187.47 (target 1) and $149.17 (target 2) - Stop-loss protection: $251.29 - Validity: through December 9, 2026 For non-traders, the call means CrowdStrike’s chart currently shows more signs of continued weakness than of a confirmed recovery.| Metric | Reading |
|---|---|
| Latest session | Tuesday, November 10, 2026 |
| Last price | $225.76 |
| Change | 1 day -1.23%; 5 days -7.73%; 1 month -13.57% |
| SMA20 / SMA50 | $241.78 / $243.88 |
| Death cross | Formed one session before the latest session |
| RSI / Stochastic | 41.0 / %K 21.2, %D 17.8 |
| MACD / signal / histogram | -5.725 / -2.015 / -3.710 |
| Support / resistance | $216.90 / $268.02 |
| Verdict | SELL |
Summary Data CRWD
| Last price | 225.76 USD |
| Change 1 day / 5 days / 1 month | -1.23% / -7.73% / -13.57% |
| Trend / MA-cross | downtrend / death |
| SMA20 / SMA50 | 241.78 / 243.88 |
| RSI (14) / Stochastic %K | 41.0 / 21.2 |
| Bollinger %B / ATR | 24% / 15.02 |
| Support / Resistance 20 days | 216.90 / 268.02 |
| Data as of | 11 November 2026 04:00 WIB |
| JournalArta research verdict (score) | Sell (-84) |
| Sell zone | 225.76 – 237.01 |
| Target 1 / 2 | 187.47 / 149.17 |
| Stop loss | 251.29 |
| Reward/risk | 1.5 / 3.0 |
Today's full Buy and Sell list for US stocks →
Disclaimer: This technical analysis is generated automatically from exchange data and indicators calculated by JournalArta, for information and education only. The verdict and the entry, target and stop-loss levels are not investment advice or a solicitation to buy or sell any security. Investment decisions and their risks rest solely with the reader.
Track CRWD stock price daily: live levels, support/resistance and our full CRWD analysis history.