Lululemon Athletica (LULU) Stock Analysis: Falls 1.92%, Golden Cross Formed
Technical analysis of LULU stock on November 10, 2026: price 110.37 USD, trend uptrend, RSI 59.0, support 94.09, resistance 112.53.

Why LULU is in focus today
- Fresh golden cross: SMA20 crossed above SMA50
- Uptrend confirmed (5-day change 3.20%)
- Not covered by JournalArta in the last 14 days
Selected automatically from 100 NASDAQ (US) stocks by a technical-signal score with daily weighted randomisation — not a recommendation.
Trend & Price Action
LULU closed at $110.37, above its 20-day average of $104.48 and 50-day average of $101.80. The 20-day average rose 4.47% over five days, reinforcing the upward trend rather than merely reflecting a brief price jump. The golden cross formed two sessions before the latest session, so it is recent, but not a signal created on Tuesday. Price is nearing the 20-session resistance at $112.53, with the stock at 88% of its recent range. A close through that level would strengthen the case that buyers can extend the advance; failure to clear it could leave the shares consolidating above their moving averages. The three-month high of $126.48 is a broader reference point, while the three-month low of $90.38 shows how far the stock has recovered. As shown in the chart, the price remains above the moving averages, while the Bollinger bands are widening.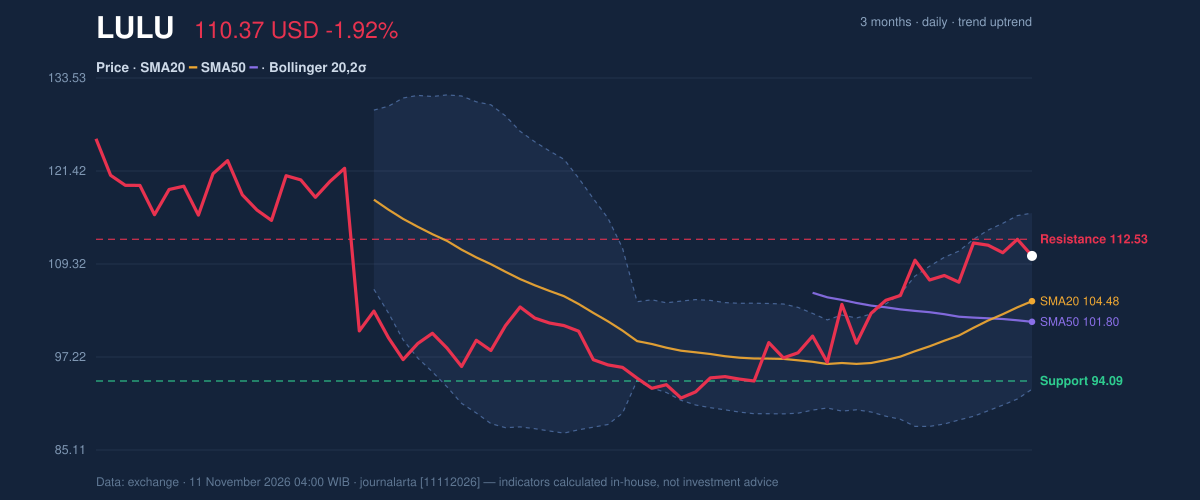
Oscillators & Momentum
Momentum indicators are supportive, but not uniformly emphatic. The RSI is neutral at 59.0, consistent with an advance that has not yet reached an extreme reading. The Stochastic is also classified as neutral, with %K at 77.6 and %D at 82.0; its elevated readings warrant attention, though the supplied signal does not classify it as overbought. The MACD is positive: its reading of 3.061 is above the 2.086 signal line, leaving a positive histogram of 0.975. That alignment supports the prevailing trend. As shown in the chart, the RSI, MACD and Stochastic provide a check on whether price strength is being confirmed by momentum rather than relying on the moving-average crossover alone.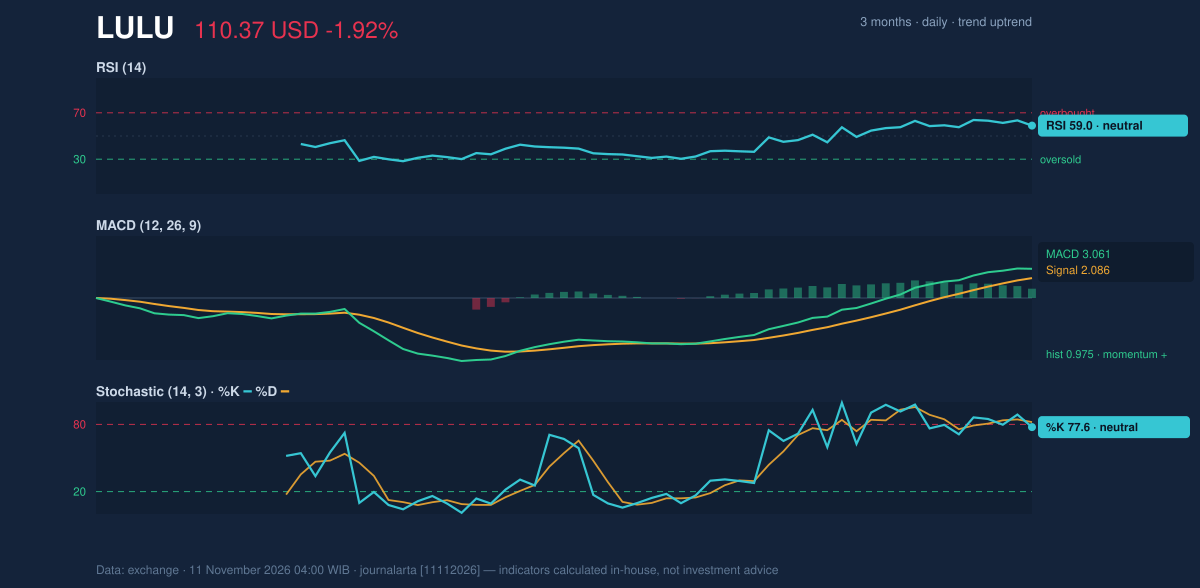
Volatility, Volume & Levels
The Bollinger-band position is constructive but leaves room for larger swings. LULU’s %B reading is 76%, placing the price in the upper portion of the bands, while the band width of 21.9% is widening. That means volatility is rising; it does not, by itself, establish the direction of the next move. The ATR is $4.91, or 4.4% of the share price, underscoring that daily fluctuations can be material. Trading volume was 2,153,500 shares, about 0.6 times the 20-day average of 3,377,865. The lighter turnover makes Tuesday’s decline less convincing as evidence of broad selling pressure, while rising OBV—a measure that tracks whether volume is accumulating on up days or down days—supports the underlying advance. The key near-term test remains $112.53 resistance; support over 20 sessions is $94.09, with the 20-day average at $104.48 offering a nearer trend reference.Fundamental Context
Technical strength sits alongside a weaker recent revenue comparison. According to its SEC filing, Lululemon reported quarterly revenue of $2.42 billion for the quarter ended August 2, 2026, down 4.3% from $2.53 billion a year earlier. Net income was $329.2 million, compared with $370.9 million in the prior-year quarter, while diluted earnings per share were $2.92. The filing’s figures add a fundamental counterweight to a chart that currently points upward.Technical Verdict: BUY
The JournalArta Research technical verdict is BUY, supported by the golden cross, the share price above its 50-day average, and rising OBV alongside an established uptrend. The main risk is the combination of widening Bollinger bands and ATR at 4.4% of price, which signals elevated volatility. The verdict is invalidated if the price falls below $102.02. - Ideal entry range: $106.69–$110.37 - Exit targets: $122.89 (Target 1) and $135.42 (Target 2) - Stop-loss protection: $102.02 - Reward/risk: 1.5 / 3.0; valid until December 9, 2026 In plain English, the technical signals favor the rising trend, but the shares remain exposed to sharp moves and a test at resistance. “We remain focused on delivering long-term growth,” Lululemon said in its SEC filing.Summary Data LULU
| Last price | 110.37 USD |
| Change 1 day / 5 days / 1 month | -1.92% / 3.20% / 16.99% |
| Trend / MA-cross | uptrend / golden |
| SMA20 / SMA50 | 104.48 / 101.80 |
| RSI (14) / Stochastic %K | 59.0 / 77.6 |
| Bollinger %B / ATR | 76% / 4.91 |
| Support / Resistance 20 days | 94.09 / 112.53 |
| Data as of | 11 November 2026 04:00 WIB |
| JournalArta research verdict (score) | Buy (+84) |
| Entry zone | 106.69 – 110.37 |
| Target 1 / 2 | 122.89 / 135.42 |
| Stop loss | 102.02 |
| Reward/risk | 1.5 / 3.0 |
Today's full Buy and Sell list for US stocks →
Disclaimer: This technical analysis is generated automatically from exchange data and indicators calculated by JournalArta, for information and education only. The verdict and the entry, target and stop-loss levels are not investment advice or a solicitation to buy or sell any security. Investment decisions and their risks rest solely with the reader.
Track LULU stock price daily: live levels, support/resistance and our full LULU analysis history.