The Trade Desk (TTD) Stock Technicals: Rises 3.28% on Tuesday, RSI Overbought
Technical analysis of TTD stock on November 10, 2026: price 15.42 USD, trend sideways, RSI 71.1, support 12.18, resistance 15.42.
Why TTD is in focus today
- Volume at 3.1× the 20-day average
- RSI(14) at 71.1 — overbought zone
- Not covered by JournalArta in the last 14 days
Selected automatically from 100 NASDAQ (US) stocks by a technical-signal score with daily weighted randomisation — not a recommendation.
Trend & Price Action
The closing price sits above the 20-day simple moving average (SMA) of $12.98 and the 50-day average of $13.13. That supports the recent rebound, but the shorter average remains below the longer one, and no new moving-average crossover has formed. In other words, price strength has improved faster than the broader trend structure. The 20-day average rose 3.47% over five days. The system still classifies the trend as sideways, reflecting that a rising short-term average alone has not settled the question of direction. The close also reached the 20-day resistance of $15.42, placing it at the top of the recorded 20-day range. The three-month high, $15.80, is the next reference point overhead. As shown in the chart, price has moved above the upper Bollinger Band, a volatility measure set around a moving average. Its %B reading of 127% means the close is beyond that band, while the band width of 24.6% is widening. This combination signals an unusually forceful move, but also elevated volatility; it does not establish that gains will continue.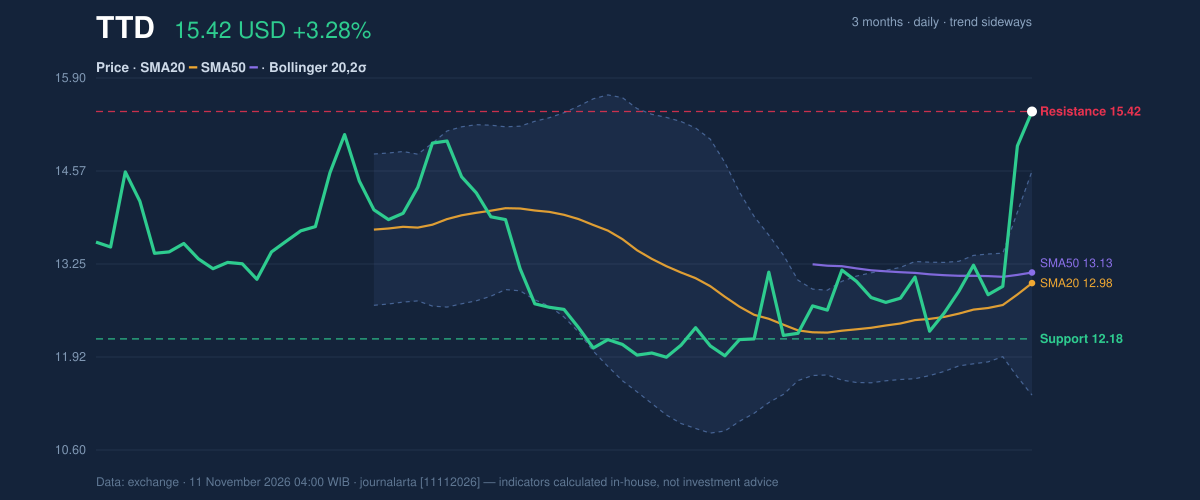
Oscillators & Momentum
Momentum indicators confirm the strength of the advance, while warning that the pace may be difficult to sustain. The RSI is 71.1, in overbought territory; the RSI measures the speed and magnitude of recent price moves. The Stochastic readings, %K 89.4 and %D 75.3, are also overbought, indicating that the close is near the upper end of its recent trading range. The MACD is positive at 0.365, above its 0.081 signal line, with a positive 0.284 histogram. MACD compares short- and longer-term price momentum, so these readings support the rally rather than contradict it. But the indicators are not all pointing to a settled trend: momentum is bullish, while the moving-average order remains unconfirmed and the trend classification is sideways.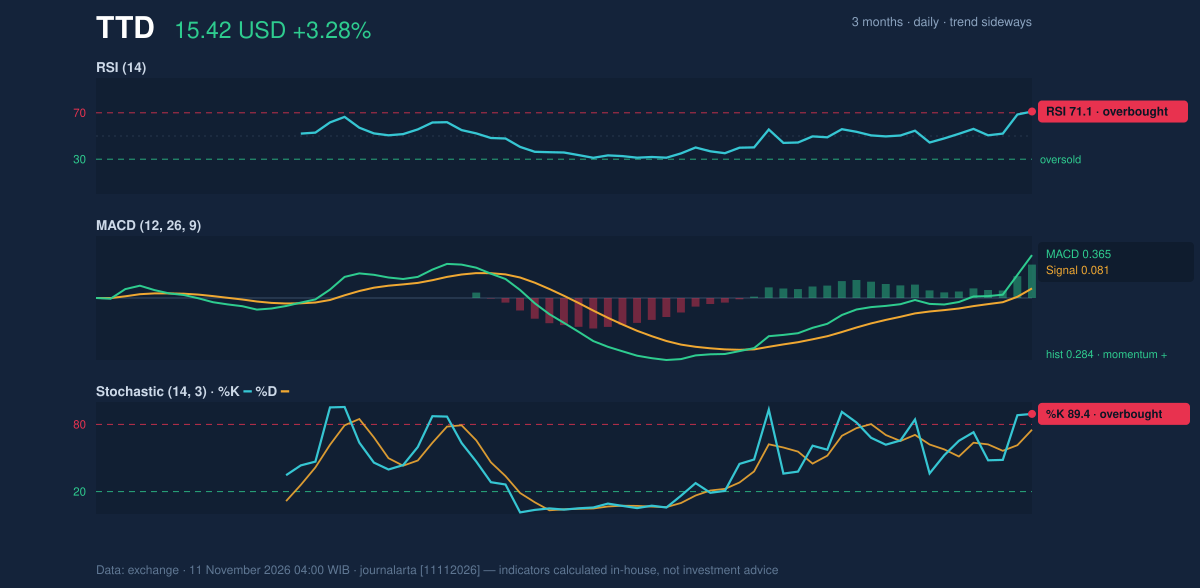
Volatility, Volume & Levels
The ATR is $0.79, or 5.1% of the share price. Average True Range estimates typical price movement, so this reading underlines the risk of large swings. The volume spike and rising OBV add evidence that buyers participated in the session; they do not remove the possibility of a pullback after the sharp five-day gain. The near-term levels are unusually clear because the close coincides with 20-day resistance. A close above $15.42 would put the three-month high of $15.80 in focus. If the stock fails to hold its advance and breaks below 20-day support at $12.18, that would weaken the breakout case; the three-month low is $11.62. The reference price-minus-1.5-ATR level is $14.24, while price plus 1.5 ATR is $16.60; these are volatility-based markers, not established support or resistance.Fundamental Context
According to its SEC filing, The Trade Desk reported quarterly revenue of $736.0 million for the quarter ended 2026-09-30, down 0.5% from $739.4 million a year earlier. Net income was $38.1 million, compared with $115.5 million a year earlier, and diluted earnings per share were $0.08. The company filed its Form 10-Q and a Form 8-K on 2026-11-09. The filings provide a separate context for the stock’s sharp market move: revenue was slightly lower year over year, while net income was also lower.Technical Verdict: HOLD (wait & see)
The required JournalArta technical call is HOLD (wait & see), with a score of +23 on a −100 to +100 scale. The strongest supporting signals are the price above its 50-day average, positive MACD momentum, and volume at 3.1 times average on an up day. Caution comes from the 20-day average remaining below the 50-day and from RSI and Stochastic readings in overbought territory. The verdict is invalidated on the downside if price breaks below $12.18, the 20-day support. Conditional reference levels: - Entry range: Above $15.42, only if price closes above 20-day resistance; this defines the upside scenario, not confirmation of a sustained trend. - Exit target: $15.80, the three-month high, as the next upside reference after a resistance break. - Stop-loss protection: $12.18, the 20-day support; a break below it defines the downside scenario. In plain English, the rally has real momentum, but the trend signals are not aligned enough to settle whether it can hold its gains.Summary Data TTD
| Last price | 15.42 USD |
| Change 1 day / 5 days / 1 month | 3.28% / 19.91% / 26.71% |
| Trend / MA-cross | sideways / none |
| SMA20 / SMA50 | 12.98 / 13.13 |
| RSI (14) / Stochastic %K | 71.1 / 89.4 |
| Bollinger %B / ATR | 127% / 0.79 |
| Support / Resistance 20 days | 12.18 / 15.42 |
| Data as of | 11 November 2026 04:00 WIB |
| JournalArta research verdict (score) | Hold (+23) |
Today's full Buy and Sell list for US stocks →
Disclaimer: This technical analysis is generated automatically from exchange data and indicators calculated by JournalArta, for information and education only. The verdict and the entry, target and stop-loss levels are not investment advice or a solicitation to buy or sell any security. Investment decisions and their risks rest solely with the reader.
Track TTD stock price daily: live levels, support/resistance and our full TTD analysis history.