General Dynamics (GD) Stock Rises 1.48% on Tuesday, Golden Cross Formed
Technical analysis of GD stock on November 10, 2026: price 367.44 USD, trend uptrend, RSI 60.3, support 334.66, resistance 374.50.

Why GD is in focus today
- Fresh golden cross: SMA20 crossed above SMA50
- Not covered by JournalArta in the last 14 days
Selected automatically from 80 NYSE (US) stocks by a technical-signal score with daily weighted randomisation — not a recommendation.
Trend & Price Action
The share price stands above the 20-day simple moving average (SMA), at $355.45, and the 50-day SMA, at $349.30. A golden cross occurs when the shorter-term average moves above the longer-term one; it can indicate that recent price momentum is strengthening relative to the longer trend. Here, that signal is supported by an uptrend and a 20-day average that rose 2.14% over five days. The advance has not been uninterrupted: the stock fell 1.89% over five days, despite gaining 10.53% over one month. That contrast suggests a short-term pause within a stronger monthly move, rather than a straightforward climb. The price is at 82% of its 20-day trading range, closer to the $374.50 resistance than the $334.66 support. The golden cross and rising averages support the uptrend, but the five-day decline and light volume temper the signal. The chart places the price against its moving averages, Bollinger bands and key levels.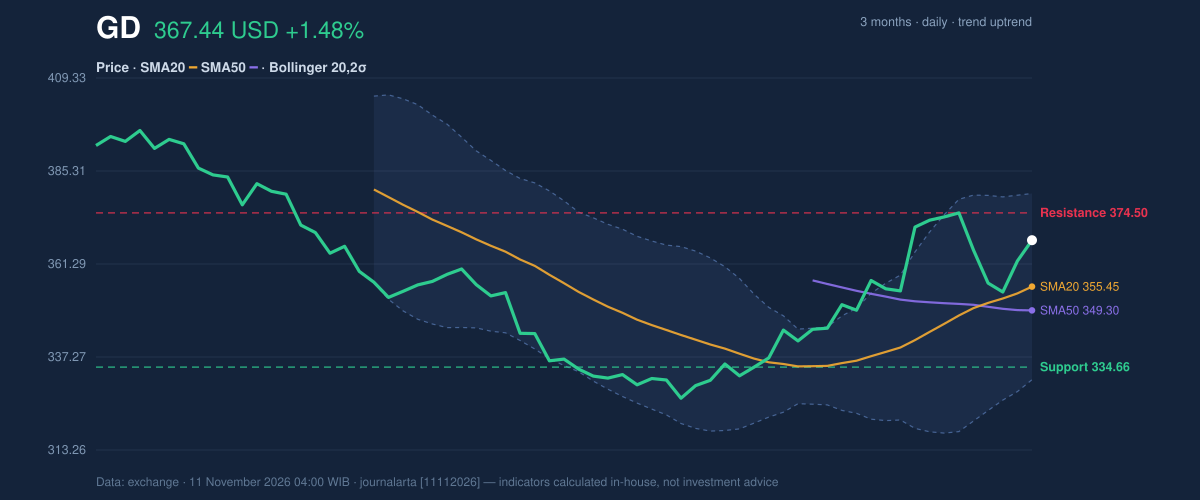
Oscillators & Momentum
Momentum indicators are broadly constructive but not overheated. The RSI, which measures the pace of recent gains and losses, is 60.3, a neutral reading. The Stochastic lines are also neutral, with %K at 54.0 and %D at 41.6. These readings suggest buyers have an edge without showing the kind of stretched conditions often associated with an overheated rally. MACD momentum is positive: the MACD reading of 5.095 is above its 4.366 signal line, and the histogram is positive at 0.729. The MACD compares shorter- and longer-term price momentum; a positive gap indicates that recent momentum is stronger than its signal baseline. A caution comes from the RSI rolling over from above 65, a bearish technical signal that could mark cooling momentum.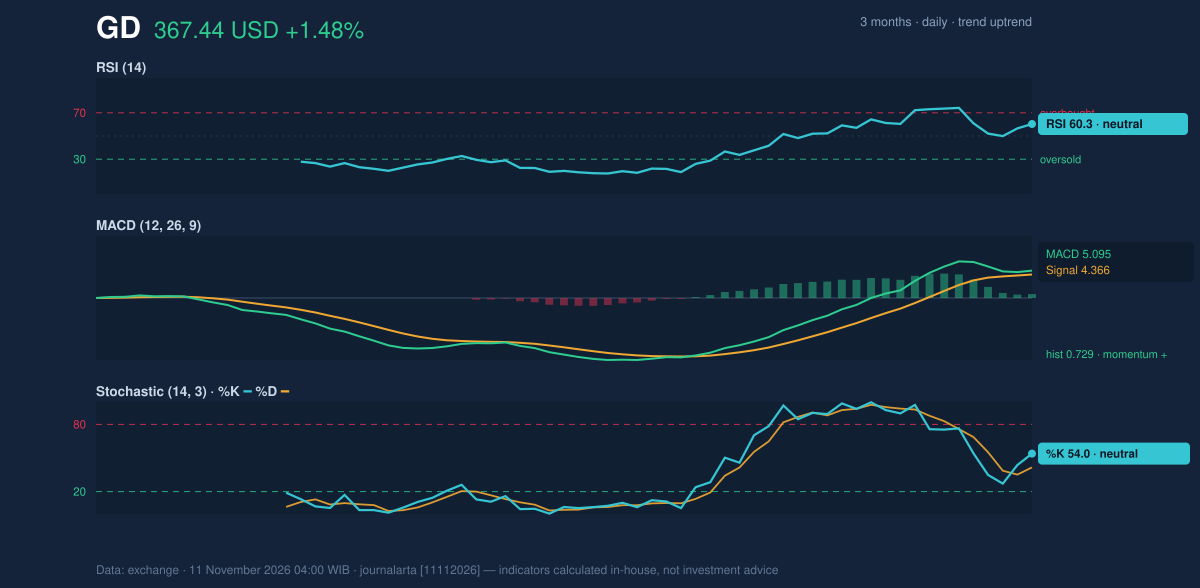
Volatility & Volume
Average true range (ATR), a measure of typical price movement, is $9.54, or 2.6% of the share price, indicating moderate volatility. Volume was 981,600 shares, about 0.7 times the 20-day average of 1,309,915. That lower participation makes the latest daily rise less conclusive as evidence of broad buying demand. On the other hand, rising on-balance volume (OBV), which tracks whether volume tends to accompany advances or declines, supports the wider uptrend.Fundamental Context
According to its SEC filing, General Dynamics reported quarterly revenue of $14.57 billion for the quarter ended 2026-10-04, up 12.9% from $12.91 billion a year earlier. Net income was $1.23 billion, compared with $1.06 billion a year earlier. The company filed a Form 8-K reporting its results of operations and financial condition on 2026-10-30.Technical Verdict: BUY
The technical verdict is BUY, in line with JournalArta Research’s score of +66 on a −100 to +100 scale. The main supports are the price above its 50-day average, the 20-day average above the 50-day, and rising OBV confirming the uptrend. The RSI’s rollover from above 65 and below-average volume remain risks. The verdict is invalidated if the price falls below the $351.19 stop level. - Ideal entry range: $360.28–$367.44 - Exit targets: $391.81 (target 1) and $416.19 (target 2) - Stop-loss protection: $351.19 - The stated reward/risk figures are 1.5 / 3.0, and the verdict is valid until December 9, 2026. In plain English, the signals favor the existing uptrend, but a drop through the specified stop level would invalidate this technical view.| Indicator | Reading |
|---|---|
| Last price | $367.44 |
| Change | 1 day: 1.48% | 5 days: −1.89% | 1 month: 10.53% |
| SMA20 / SMA50 | $355.45 / $349.30 |
| Golden cross | Formed 3 sessions before the latest session |
| RSI(14) | 60.3, neutral |
| MACD / signal / histogram | 5.095 / 4.366 / 0.729 |
| Support / resistance | $334.66 / $374.50 |
Summary Data GD
| Last price | 367.44 USD |
| Change 1 day / 5 days / 1 month | 1.48% / -1.89% / 10.53% |
| Trend / MA-cross | uptrend / golden |
| SMA20 / SMA50 | 355.45 / 349.30 |
| RSI (14) / Stochastic %K | 60.3 / 54.0 |
| Bollinger %B / ATR | 75% / 9.54 |
| Support / Resistance 20 days | 334.66 / 374.50 |
| Data as of | 11 November 2026 04:00 WIB |
| JournalArta research verdict (score) | Buy (+66) |
| Entry zone | 360.28 – 367.44 |
| Target 1 / 2 | 391.81 / 416.19 |
| Stop loss | 351.19 |
| Reward/risk | 1.5 / 3.0 |
Today's full Buy and Sell list for US stocks →
Disclaimer: This technical analysis is generated automatically from exchange data and indicators calculated by JournalArta, for information and education only. The verdict and the entry, target and stop-loss levels are not investment advice or a solicitation to buy or sell any security. Investment decisions and their risks rest solely with the reader.
Track GD stock price daily: live levels, support/resistance and our full GD analysis history.