Walt Disney (DIS) Stock on Tuesday: Rises 0.08%, RSI Overbought
Technical analysis of DIS stock on November 10, 2026: price 119.21 USD, trend uptrend, RSI 70.6, support 108.99, resistance 119.21.

Why DIS is in focus today
- Closed at a 20-day high (119.21)
- Trading near its 3-month high (120.80)
- RSI(14) at 70.6 — overbought zone
- Uptrend confirmed (5-day change 4.41%)
Selected automatically from 80 NYSE (US) stocks by a technical-signal score with daily weighted randomisation — not a recommendation.
Trend & Price Action
Disney is trading above both its 20-day simple moving average of $112.95 and its 50-day average of $108.49. The 20-day average rose 2.47% over five days, reinforcing the uptrend. The 20-day average remains above the 50-day average, but there was no new moving-average crossover in the latest session; the trend is established rather than newly confirmed by a fresh cross. The shares ended at the 20-day resistance level of $119.21, at the top of the 20-day range and close to the three-month high of $120.80. This is a test of supply: a close above resistance would indicate that buyers can extend the advance, while a failure to clear it could leave the stock consolidating after its recent gains. The price structure is bullish, but the shares are pressing against resistance rather than breaking decisively beyond it.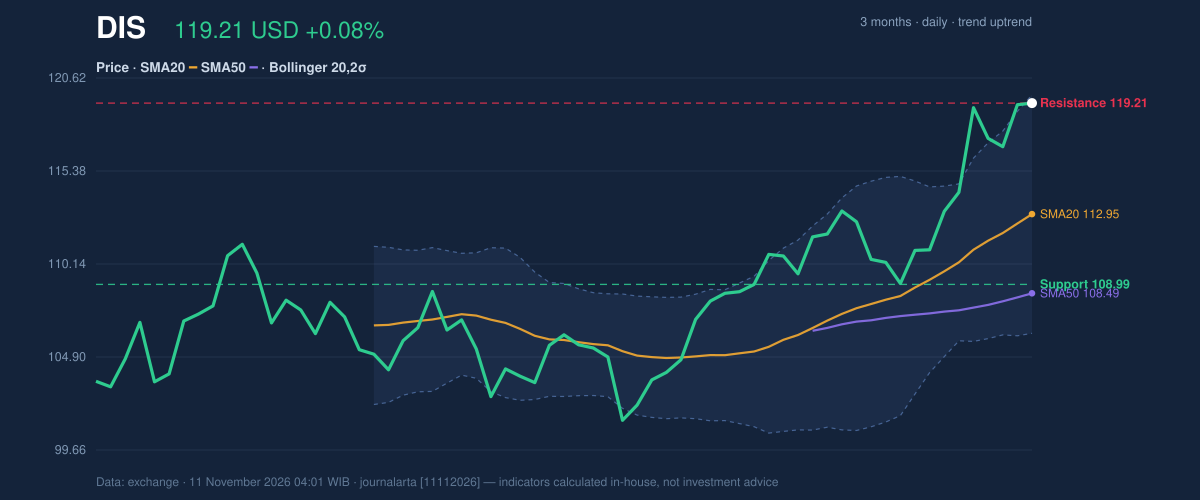
Oscillators & Momentum
The momentum indicators confirm the rally, but also show why caution is warranted. The RSI is 70.6, in overbought territory; RSI compares the strength of recent gains with losses, and a reading above 70 often signals that an advance has become stretched. It does not by itself establish that a reversal is underway. The Stochastic readings are also overbought, with %K at 86.8 and %D at 79.8. Meanwhile, the MACD remains positive: its reading of 2.883 is above the 2.214 signal line, and the histogram is positive at 0.669. That suggests upward momentum is still intact, even as the oscillators warn that the pace may be difficult to sustain. The signals are therefore not fully aligned: trend-following measures favor the advance, while short-term momentum gauges point to crowding.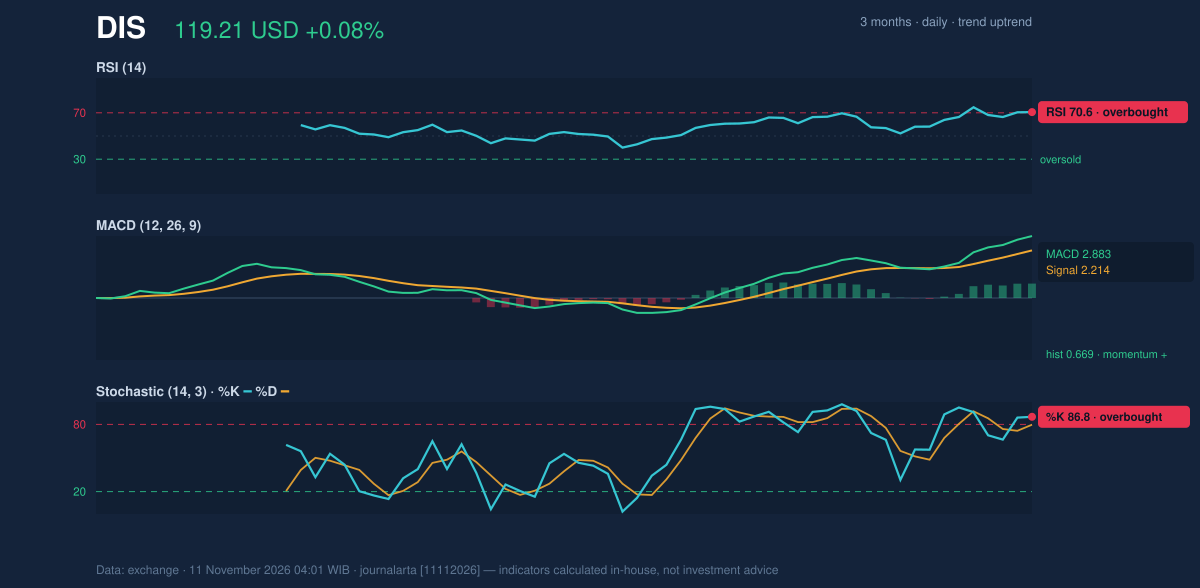
Volatility, Volume & Levels
Disney’s Bollinger %B reading is 97%, placing the price close to the upper band at $119.67. The bands’ 11.9% width is classified as normal, not unusually tight or expanded. In plain terms, the stock is near the upper edge of its recent volatility range, but the bands do not indicate an exceptional volatility squeeze. ATR is $2.56, or 2.2% of the share price, consistent with moderate daily price movement. Volume was 8,000,200 shares, roughly in line with the 20-day average of 8,142,720. OBV, which tracks whether volume tends to accompany rising or falling prices, is increasing. That supports the advance, though trading was not unusually heavy. The key downside reference is $108.99, the 20-day support level. The three-month low is $101.15. A break below support would weaken the current price structure; holding above it would leave the broader uptrend intact. The upper Bollinger band at $119.67 and three-month high at $120.80 frame the immediate test above.Fundamental Context
According to its SEC filing, Disney reported quarterly revenue of $25.25 billion for the quarter ended 2026-06-27, up 6.8% from $23.65 billion a year earlier. Net income was $2.64 billion, compared with $5.26 billion a year earlier, and diluted earnings per share were $1.51. The revenue growth offers a constructive operating signal, while the lower net income is a reminder that top-line expansion alone does not describe the full earnings picture.Technical Verdict: HOLD (wait & see)
The JournalArta Research verdict is HOLD (wait & see). The main supports are the rising trend, the price above both moving averages, and increasing OBV. Against those positives, RSI and Stochastic are overbought, and the latest close sits at 20-day resistance. The verdict would be invalidated if the price breaks below $108.99, the 20-day support level.- Ideal Entry Range: Conditional upside scenario above $119.21, the 20-day resistance, with confirmation only if the price closes above that level.
- Exit Target (Target Price): $120.80, the three-month high, as the next reference if resistance is cleared.
- Stop Loss protection: $108.99, the 20-day support; a break below it would undermine the uptrend scenario.
Summary Data DIS
| Last price | 119.21 USD |
| Change 1 day / 5 days / 1 month | 0.08% / 4.41% / 9.79% |
| Trend / MA-cross | uptrend / none |
| SMA20 / SMA50 | 112.95 / 108.49 |
| RSI (14) / Stochastic %K | 70.6 / 86.8 |
| Bollinger %B / ATR | 97% / 2.56 |
| Support / Resistance 20 days | 108.99 / 119.21 |
| Data as of | 11 November 2026 04:01 WIB |
| JournalArta research verdict (score) | Hold (+58) |
Today's full Buy and Sell list for US stocks →
Disclaimer: This technical analysis is generated automatically from exchange data and indicators calculated by JournalArta, for information and education only. The verdict and the entry, target and stop-loss levels are not investment advice or a solicitation to buy or sell any security. Investment decisions and their risks rest solely with the reader.
Track DIS stock price daily: live levels, support/resistance and our full DIS analysis history.