General Motors (GM) Stock Analysis: Falls 1.07%, Golden Cross Formed
Technical analysis of GM stock on November 10, 2026: price 88.69 USD, trend uptrend, RSI 57.0, support 75.92, resistance 92.43.

Why GM is in focus today
- Fresh golden cross: SMA20 crossed above SMA50
- Not covered by JournalArta in the last 14 days
Selected automatically from 80 NYSE (US) stocks by a technical-signal score with daily weighted randomisation — not a recommendation.
Trend & Price Action
GM closed above its 20-day average of $83.84 and 50-day average of $83.48. The 20-day average rose 2.06% over five days, indicating that the short-term trend has been strengthening rather than merely holding steady. The golden cross formed one session before November 10; it is a recent signal, but not one formed on the latest session. The price has gained 0.40% over five days and 5.58% over one month, despite the latest session’s drop. At 77% of its 20-day range, it is nearer resistance than support. The three-month high is $93.70, while the low is $74.59, placing the current price well above the period’s floor but below its peak. As shown in the chart, the rising averages support the uptrend, while the upper Bollinger band and nearby resistance mark areas where further gains may meet friction.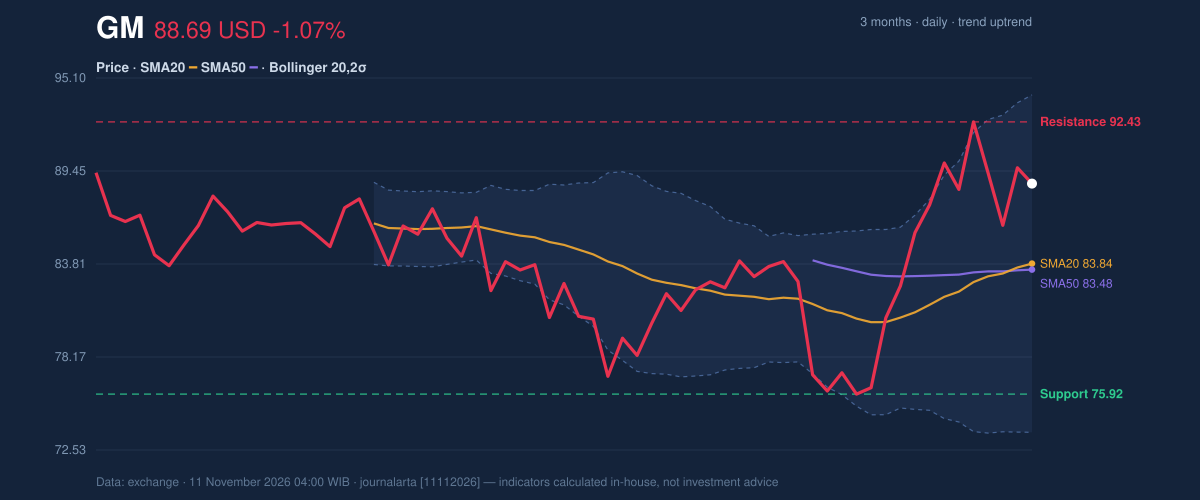
Oscillators & Momentum
Momentum indicators are broadly positive but not uniformly strong. RSI is neutral at 57.0, suggesting neither an overbought nor oversold condition. Stochastic readings are also neutral, with %K at 73.8 and %D at 71.0. The elevated readings place the oscillator near the upper part of its scale, but the supplied classification remains neutral. MACD is positive at 1.954 versus a 1.167 signal line, with a 0.787 histogram. This means the faster momentum measure remains above its comparison line, consistent with upward pressure. However, one bearish technical signal is that RSI has rolled over from above 65, a warning that momentum has eased from a stronger level. The chart helps distinguish that moderation from a confirmed trend reversal: MACD remains positive, while RSI’s retreat argues against treating the move as unambiguously accelerating.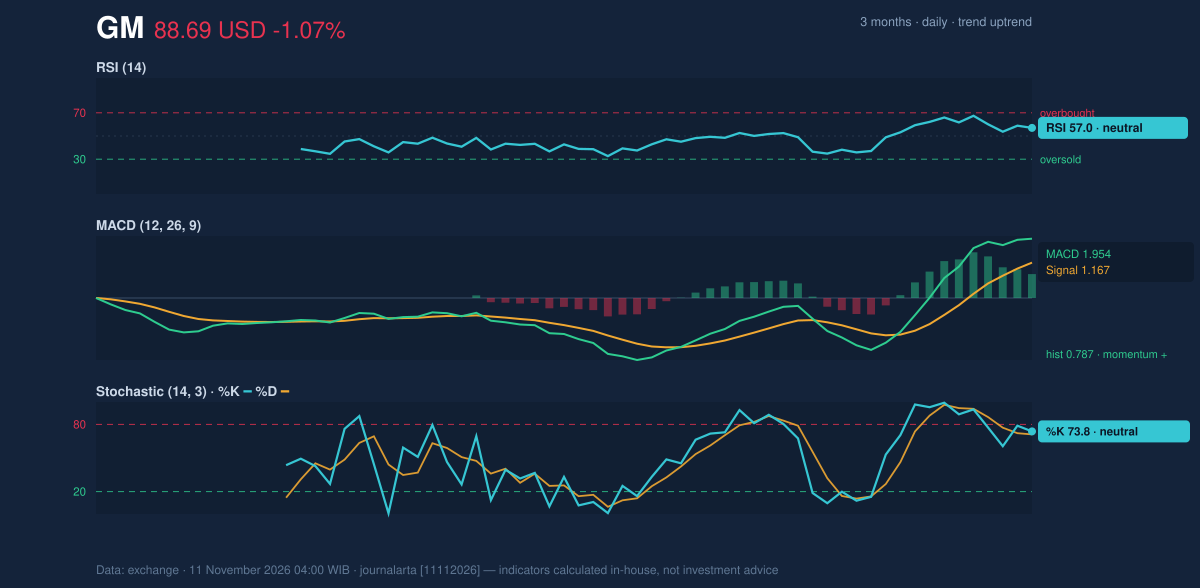
Volatility, Volume & Key Levels
Average true range, a measure of typical price movement, is $3.27, or 3.7% of the share price—high volatility by the supplied data. The latest volume of 6,833,700 shares was 0.8 times the 20-day average of 9,067,430. That lighter participation makes the session’s decline less forceful as evidence of broad selling, though it also means the recent advance has not been confirmed by unusually heavy trading. On the levels supplied, $92.43 is 20-day resistance and $75.92 is 20-day support. The three-month high of $93.70 sits above that resistance area. A move through resistance would put the recent high in focus; a failure to hold the short-term averages would weaken the bullish structure, while a break below support would represent a more serious deterioration.Fundamental Context
According to its SEC filing, General Motors reported quarterly revenue of $45.71 billion for the quarter ended September 30, 2026, up 3.3% from $44.26 billion a year earlier. Net income was $3.34 billion, compared with $1.33 billion a year earlier, and diluted earnings per share were $3.73. Separately, the company filed a Form 8-K on October 29 reporting a change of directors or officers. These disclosures provide business context; the verdict below is based on the supplied technical signals.Technical Verdict: BUY
The JournalArta Research verdict is BUY, supported by three bullish signals against one bearish signal: the golden cross, an uptrend with the share price above the 50-day average, and rising OBV, which tracks buying and selling volume over time. The positive MACD adds support, while RSI rolling over from above 65 is the main caution. The verdict is invalidated if the price falls below $83.14. - Entry range: $86.25–$88.69 - Exit targets: $97.01 (target one) and $105.34 (target two) - Stop-loss protection: $83.14 - Valid until: December 9, 2026 For non-traders, the technical setup currently favors further strength, but the signal would be weakened by a decline through the specified protection level.| Indicator | Reading |
|---|---|
| Latest price | $88.69 |
| Change | 1 day: -1.07% | 5 days: 0.40% | 1 month: 5.58% |
| 20-day / 50-day average | $83.84 / $83.48 |
| Golden cross | Formed one session before the latest session |
| RSI / Stochastic | 57.0 / %K 73.8, %D 71.0 |
| MACD / signal / histogram | 1.954 / 1.167 / 0.787 |
| 20-day support / resistance | $75.92 / $92.43 |
| Volume vs. 20-day average | 6,833,700 vs. 9,067,430 |
Summary Data GM
| Last price | 88.69 USD |
| Change 1 day / 5 days / 1 month | -1.07% / 0.40% / 5.58% |
| Trend / MA-cross | uptrend / golden |
| SMA20 / SMA50 | 83.84 / 83.48 |
| RSI (14) / Stochastic %K | 57.0 / 73.8 |
| Bollinger %B / ATR | 74% / 3.27 |
| Support / Resistance 20 days | 75.92 / 92.43 |
| Data as of | 11 November 2026 04:00 WIB |
| JournalArta research verdict (score) | Buy (+76) |
| Entry zone | 86.25 – 88.69 |
| Target 1 / 2 | 97.01 / 105.34 |
| Stop loss | 83.14 |
| Reward/risk | 1.5 / 3.0 |
Today's full Buy and Sell list for US stocks →
Disclaimer: This technical analysis is generated automatically from exchange data and indicators calculated by JournalArta, for information and education only. The verdict and the entry, target and stop-loss levels are not investment advice or a solicitation to buy or sell any security. Investment decisions and their risks rest solely with the reader.
Track GM stock price daily: live levels, support/resistance and our full GM analysis history.