COST Stock Technicals Today: Gains 1.52%, Golden Cross Formed
On Agustus 24, 2026: price 947.74 USD, trend sideways, RSI 48.6, support 933.51, resistance 974.03. technical analysis of cost stock. COST Stock Technicals —…
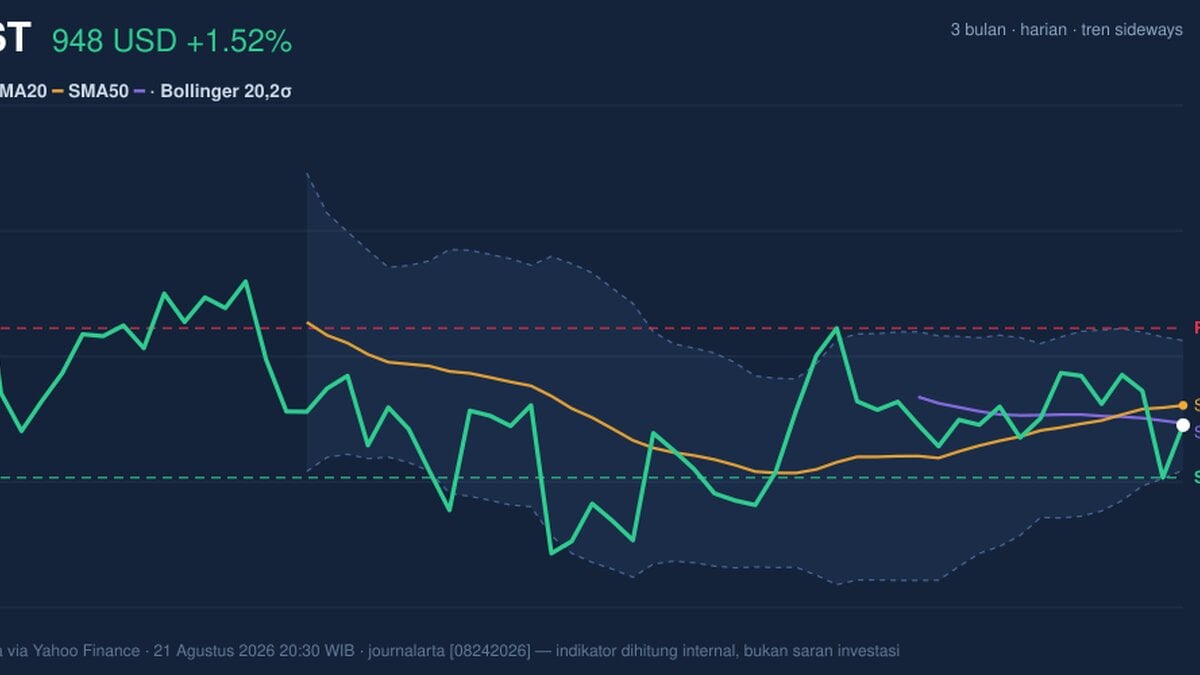
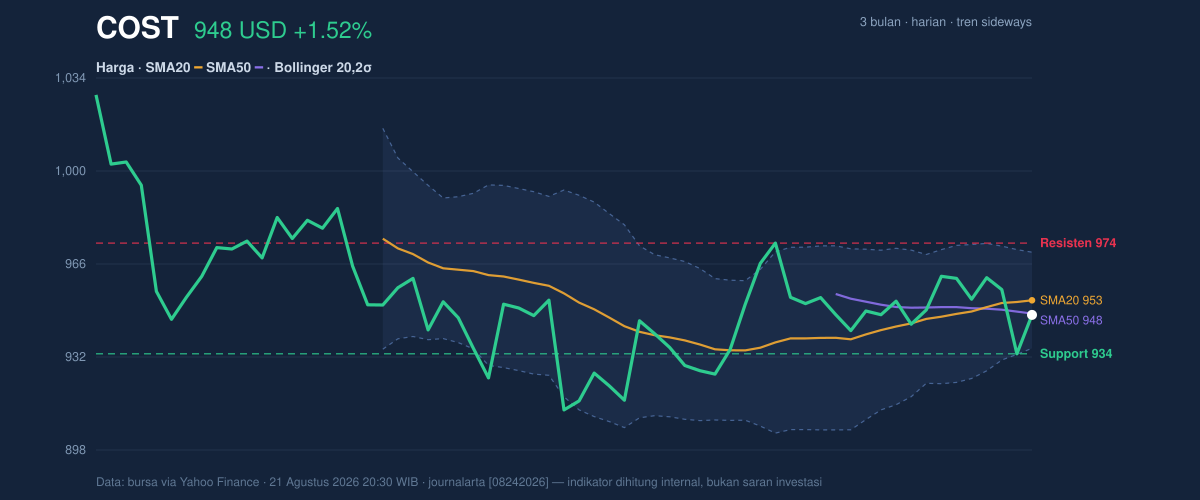
Costco Wholesale Corp. shares on NASDAQ rose to 947.74 USD in the latest session, up 1.52% from the previous close of 933.51, but the move left the stock still trading below SMA20 at 953.09 even as a golden cross remains in place on the daily chart. That combination matters: the market is not in a clean uptrend, but neither is it in a decisive downtrend. Instead, COST is hovering in a narrow technical band where short-term buyers have not fully reclaimed control, while longer-term trend structure still leans constructive.
Trend & Price Action
The broader pattern is best described as sideways, and the slope of SMA20 at 0.53% over 5 days suggests the trend is trying to stabilize rather than accelerate. The fact that the price is below SMA20 but the 20-day average is still above the 50-day average — a golden cross — tells a nuanced story. In plain terms, the longer setup remains healthier than the latest price action, but the stock has not yet converted that structural support into immediate upside momentum.
That tension is visible in the range data. COST is sitting around 35% of the 20-hour range, with support at 933.51 and resistance at 974.03. So the shares are closer to the lower half of the band than the upper edge, which usually means the market is waiting for a catalyst rather than extending a strong trend. The stock is also trading between its 3-month low of 907.21 and 3-month high of 1,045.64, which keeps the medium-term picture balanced: there is room above, but the chart has not yet proven it can reclaim higher ground.
The price sits in a pause zone, not a breakout zone.
Oscillators & Momentum
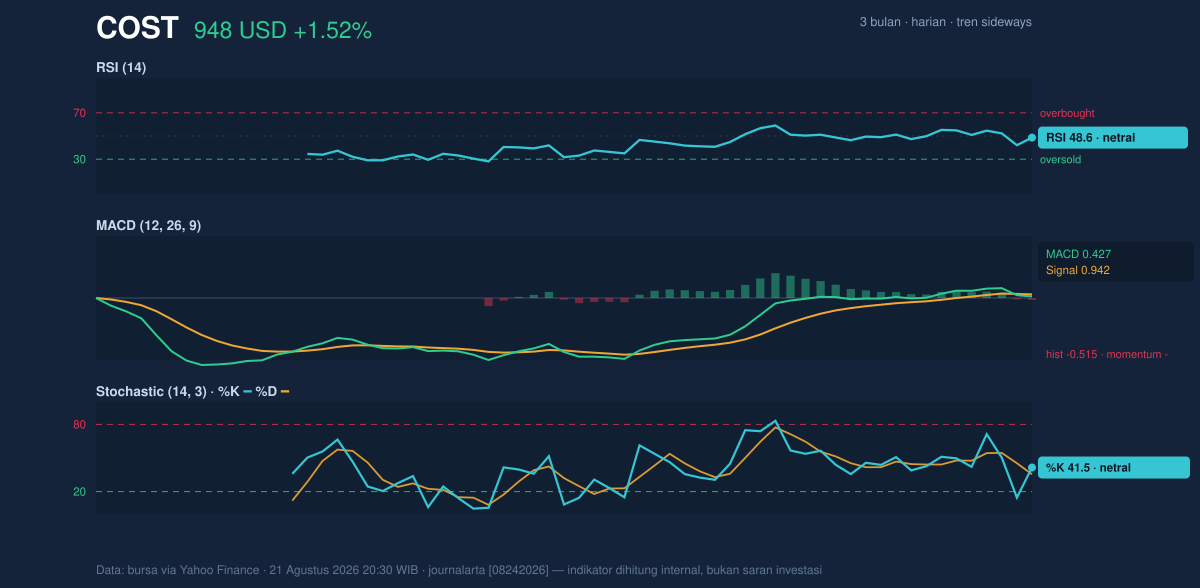
Momentum indicators are mostly neutral, but not fully supportive. The RSI at 48.6 is near the midpoint, which means the stock is neither overbought nor oversold. That typically signals indecision, not conviction. The Stochastic %K at 41.5 and %D at 35.5 also point to a market that has cooled from stronger levels without becoming technically washed out. In other words, short-term momentum has reset, but not enough to suggest an immediate reversal by itself.
The more cautionary signal comes from MACD. With MACD at 0.427, the signal line at 0.942, and a histogram of -0.515, the momentum profile is still negative. For general readers, the histogram shows whether the trend is gaining or losing strength; a negative reading means the faster-moving line is still lagging the signal line, so downside pressure or at least upside hesitation remains in place. That is important because it tempers the otherwise bullish message from the golden cross.
RSI and Stochastic are neutral, but MACD still leans negative.
Volatility & Volume
The Bollinger Band structure adds another layer. With the middle band at 953.09, the same level as SMA20, and the upper/lower bands at 970.68 and 935.51, COST is trading below the center of its recent volatility envelope. The %B reading of 35% means price is closer to the lower band than the upper band, reinforcing the idea that the stock is not yet pressing the top of its short-term range. More importantly, the 3.7% band width indicates a squeeze. That matters because compressed bands often precede a larger move; the market is storing energy rather than expressing it. The direction of that move is not guaranteed, but the setup increases the odds of a sharper break once price escapes the current range.
Volume is giving partial confirmation, but not enough to settle the argument. The latest volume of 2,365,600 was about 1.3× normal versus the 20-day average of 1,866,325. Higher-than-average participation on a modest daily gain suggests there is interest in the name, yet the OBV is down, which means cumulative volume flow has not fully supported the recent price action. That divergence matters: if price rises while OBV falls, the rally may be lacking broad accumulation. So the latest session showed activity, but not a clean vote of confidence from the volume trend.
Volatility is compressed, but volume has not fully confirmed strength.
Key Levels & Scenarios
The chart’s most important line in the sand is support at 933.51. That level is doubly important because it is also the previous close and sits just above the lower Bollinger band at 935.51. If that area holds, the stock can continue to base inside the current squeeze and test the higher band structure. If it fails, the market would be signaling that the recent rebound has been rejected and that the lower end of the 3-month range near 907.21 could come back into focus.
On the upside, 974.03 is the first resistance to watch, sitting just above the upper Bollinger band at 970.68. A move through that zone would matter because it would show the stock is not only reclaiming its recent range but also pushing beyond the volatility ceiling. That is the kind of break that would make the golden cross more meaningful in practice, rather than just on paper. Until then, the chart remains trapped between support and resistance, with momentum only partially aligned.
Resistance at 974.03 is the first real test of whether the squeeze resolves upward.
Technical Verdict: HOLD (wait & see)
HOLD (wait & see)
- Golden cross keeps the broader structure constructive, but price below SMA20 at 953.09 shows near-term recovery is incomplete.
- MACD histogram at -0.515 signals momentum is still negative, even though RSI at 48.6 and Stochastic at 41.5/35.5 are neutral.
- Bollinger bands are squeezing with 3.7% width, so the next directional move may be larger, but it has not yet revealed itself.
Verdict invalidated if price breaks below 933.51.
- Ideal Entry Range: 935.51 to 953.09
- Exit Target: 970.68 to 974.03
- Stop Loss: below 933.51
For non-traders, this means the stock is waiting for a clearer signal before the chart shows whether the next move is a rebound or a retreat.
Costco’s latest 20-hour support and resistance remain 933.51 and 974.03.
Summary Data COST
| Last price | 947.74 USD |
| Change 1 day / 5 days / 1 month | 1.52% / -1.39% / 1.36% |
| Trend / MA-cross | sideways / golden |
| SMA20 / SMA50 | 953.09 / 948.22 |
| RSI (14) / Stochastic %K | 48.6 / 41.5 |
| Bollinger %B / ATR | 35% / 17.29 |
| Support / Resistance 20 days | 933.51 / 974.03 |
| Data as of | 21 Agustus 2026 20:30 WIB |
Track COST stock price daily: live levels, support/resistance and our full COST analysis history.