CSCO Stock Gains 1.32% Today, Testing Support Level
On Agustus 24, 2026: price 111.04 USD, trend sideways, RSI 42.1, support 109.59, resistance 123.88. technical analysis of csco stock. CSCO Stock Gains — full…
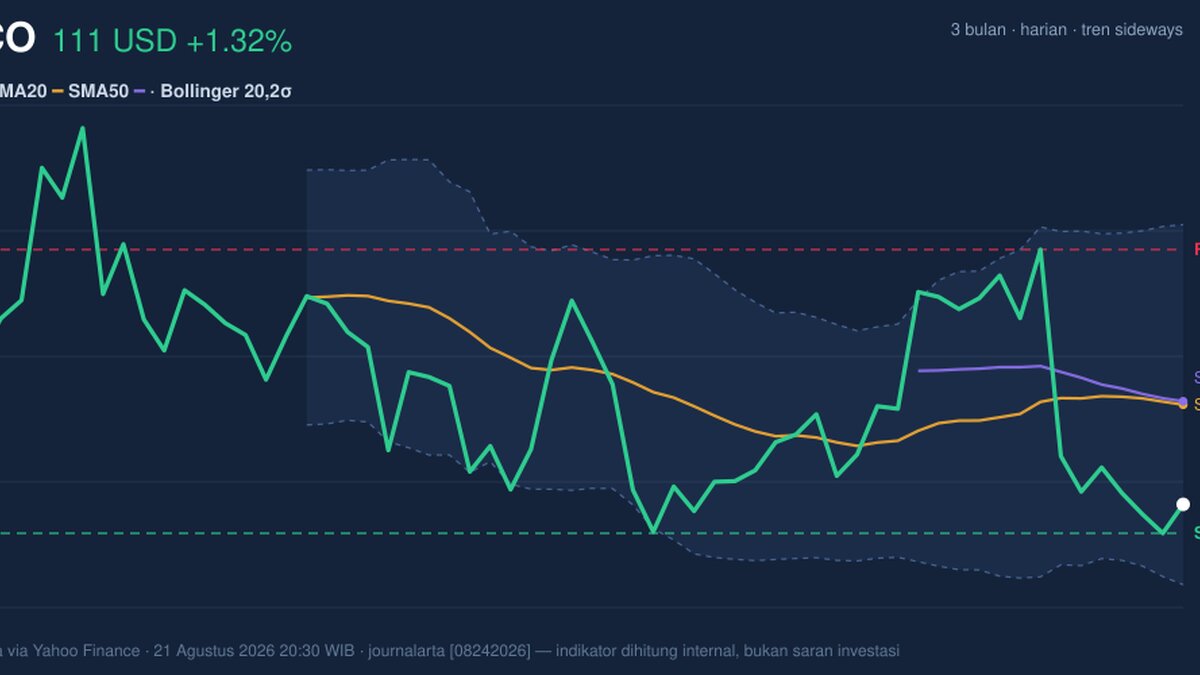
Cisco Systems, Inc. (NASDAQ: CSCO) traded at 111.04 USD after a 1.32% daily gain from the previous close of 109.59, but the move does not yet change the bigger picture: the stock is still sitting below its short- and medium-term averages, and the chart is showing a market that is trying to stabilize rather than break out. As shown in the chart, the recent bounce has lifted price off the lower part of its range, yet the signal mix still points to a cautious, range-bound setup.
Trend & Price Action
The most important signal is that CSCO remains below the SMA20 at 116.07 and below the SMA50 at 116.24. That matters because moving averages often act like a consensus line for traders: when price trades under them, rallies tend to be treated as attempts to recover lost ground rather than proof of a new uptrend. The lack of a fresh MA-cross also means there is no new crossover signal to suggest a trend reversal.
The broader trend is still described as sideways, with the SMA20 slope at -0.27% over 5 days. In plain terms, the short-term average is tilting down, which tells readers the stock has not yet built enough sustained buying pressure to flatten that drift. The stock is also trading near the lower half of its recent range, with support at 109.59 and resistance at 123.88. That places the latest price only a small distance above support, which is usually a sign that downside protection is being tested before any meaningful recovery can be trusted.
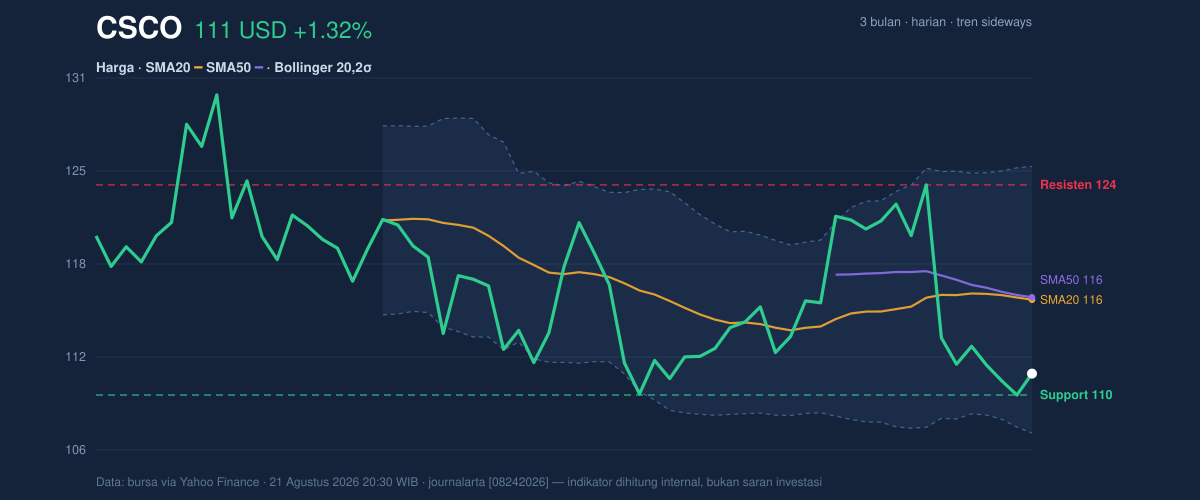
The Bollinger band structure reinforces that reading. Price is below the middle band, which sits at 116.07, and the lower band is 107.00. With %B at 22%, CSCO is trading close to the lower end of the band structure, meaning the stock is not extended to the upside and still has room to mean-revert if buyers step in. But the signal is not a bullish breakout in disguise; it is more consistent with a market probing for a floor.
Oscillators & Momentum
The momentum picture is mixed, and that mix is exactly what makes this setup interesting. The RSI at 42.1 is neutral, which means the stock is neither overbought nor deeply oversold. That usually describes a market in transition, not one with a strong directional commitment. By contrast, the Stochastic %K at 11.7 and %D at 5.8 are in oversold territory. Stochastic is more sensitive than RSI, so this often signals that recent selling has become stretched even if the broader momentum picture has not fully turned.
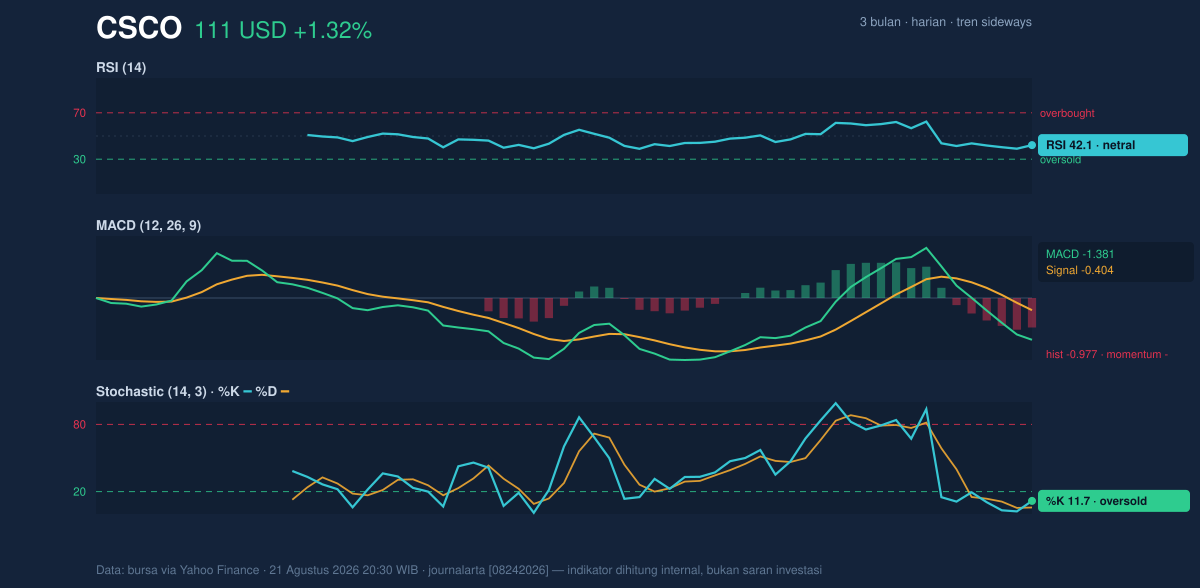
The problem is that the trend confirmation tools are not yet cooperating. MACD is -1.381, below the signal line at -0.404, with a histogram of -0.977. That combination means downside momentum is still dominant, and the gap between MACD and its signal line shows the bearish pressure has not fully faded. In other words, the oscillators are hinting at exhaustion, but MACD says that exhaustion has not yet become a confirmed reversal. That divergence often leads to choppy trading rather than a clean trend change.
Volatility & Volume
Volatility is not low here. ATR(14) at 4.25 equals 3.8% of price, which means daily swings can be wide enough to shake out short-term positions. This matters because a stock sitting near support with elevated ATR can move quickly in either direction once it leaves the current congestion zone. The Bollinger band width of 15.6% is described as normal, so the stock is not in a compression phase that typically precedes a violent breakout. Instead, it looks like a routine but potentially active range.
Volume does not yet validate the rebound. The latest turnover was 18,393,400, below the 20-day average of 23,026,850, or about 0.8x normal. That tells readers the bounce happened without full participation, which weakens the case that buyers have decisively returned. The OBV is falling, and that is a key warning sign because On-Balance Volume tracks whether volume is flowing into the stock or out of it. A falling OBV alongside a price rebound usually means the bounce has not yet won the vote of longer-horizon traders.
Key Levels & Scenarios
The immediate technical map is clear. 109.59 is the first support to watch, and 107.00 is the lower Bollinger band, which becomes the next reference if support gives way. On the upside, 116.07 and 116.24 form the first recovery zone because they are the SMA20 and SMA50. Above that, 123.88 is the key resistance, and the stock’s 3-month high of 130.37 remains the broader ceiling that would only come back into view if momentum improves materially.
If CSCO holds above 109.59 and starts reclaiming the 116.07-116.24 area, the chart would begin to shift from a defensive posture to a more constructive range recovery. If it fails to hold 109.59, the market would be signaling that the recent bounce was only a pause inside a still-pressured structure, with 107.00 then acting as the next technical checkpoint.
Technical Verdict: HOLD (wait & see)
HOLD (wait & see) — the chart shows a rebound, but not yet a confirmed trend reversal.
- Reason 1: Price is still below SMA20 (116.07) and SMA50 (116.24), so the stock has not regained its short- or medium-term trend lines.
- Reason 2: MACD remains negative at -1.381 with a bearish histogram, which means downside momentum is still in place.
- Reason 3: Stochastic is oversold at 11.7/5.8, suggesting a bounce is possible, but volume is only 0.8x normal and OBV is falling, so the move lacks strong confirmation.
- Verdict invalidated if price breaks below 109.59.
- Ideal Entry Range: 109.59 to 116.07
- Exit Target: 123.88
- Stop Loss protection: 107.00
In plain English: CSCO looks pinned in a range, with a bounce possible, but the chart has not yet proved that buyers are back in control.
The latest close was 111.04 USD.
Summary Data CSCO
| Last price | 111.04 USD |
| Change 1 day / 5 days / 1 month | 1.32% / -0.57% / -2.74% |
| Trend / MA-cross | sideways / none |
| SMA20 / SMA50 | 116.07 / 116.24 |
| RSI (14) / Stochastic %K | 42.1 / 11.7 |
| Bollinger %B / ATR | 22% / 4.25 |
| Support / Resistance 20 days | 109.59 / 123.88 |
| Data as of | 21 Agustus 2026 20:30 WIB |
Track CSCO stock price daily: live levels, support/resistance and our full CSCO analysis history.