HSBC Stock Gains 1.05%, Testing Support Level In Focus
On Agustus 24, 2026: price 1,518.40 GBp, trend sideways, RSI 50.7, support 1,497.20, resistance 1,597.40. technical analysis of hsbc stock.
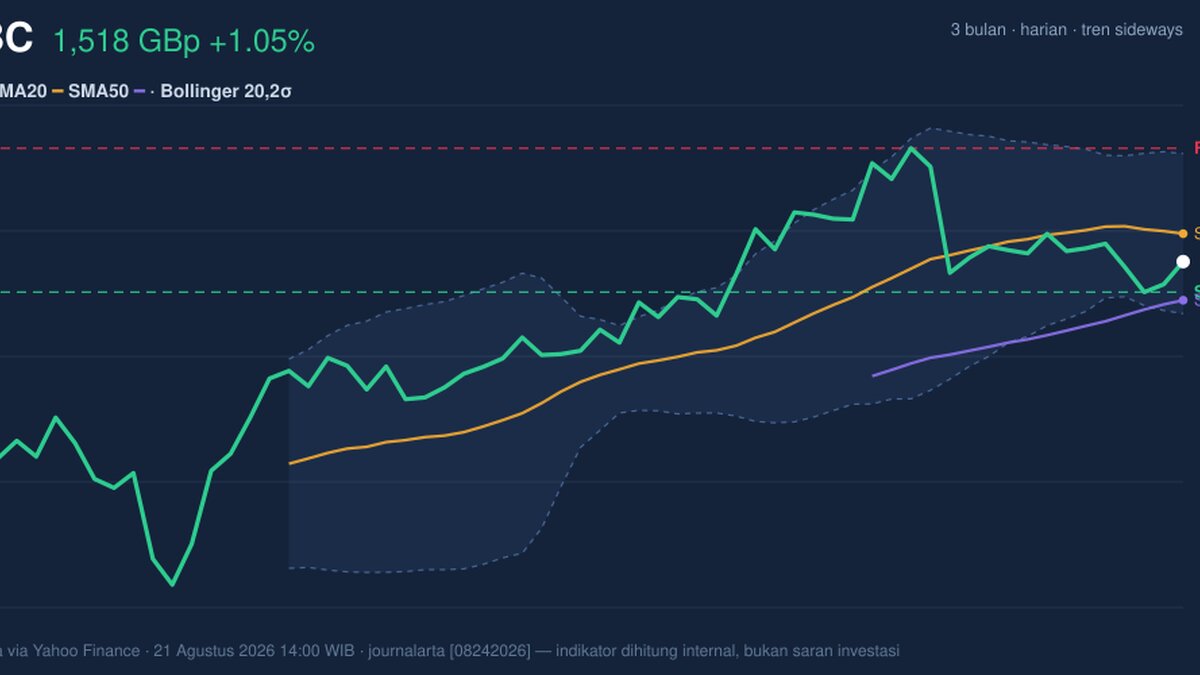
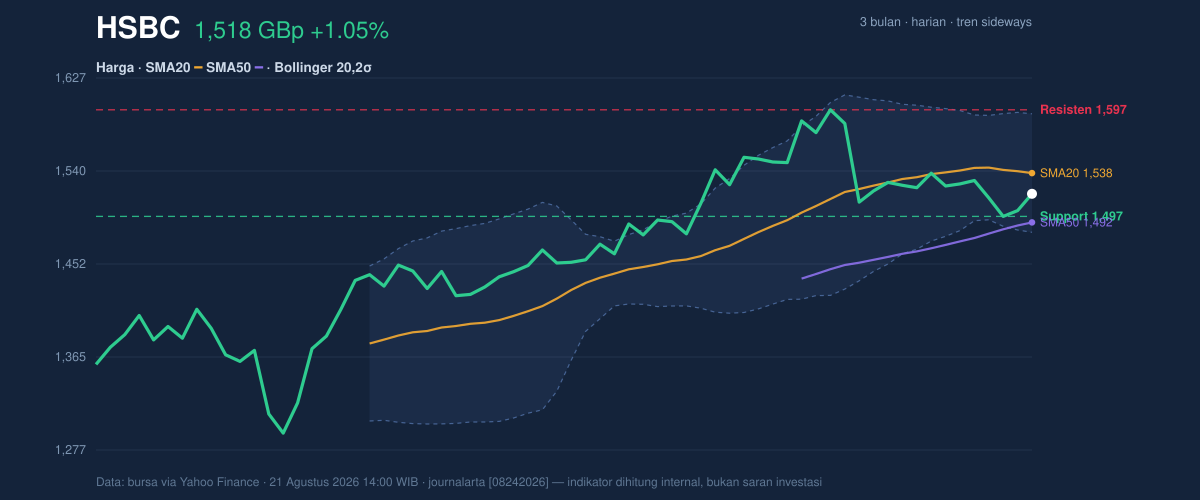
HSBC Holdings was trading at 1,518.40 GBp on LSE on 21 August 2026 at 14:00 WIB, up 1.05% on the day, but the broader tape still looks cautious: the shares sit below the 20-day moving average at 1,537.96 even as they remain above the 50-day average at 1,491.59. That is the classic shape of a stock trying to stabilise inside a wider sideways pattern rather than breaking into a clean uptrend. The chart also shows the Bollinger band range narrowing, which often means the market is compressing before it chooses a direction.
Trend & Price Action
As shown in the chart, HSBC’s price is positioned in the lower-middle part of its recent range, with the share price at 1,518.40 GBp versus support at 1,497.20 and resistance at 1,597.40. That places the stock at roughly 21% of the 20-hour range, which suggests it is not yet pressing the upper boundary where momentum usually strengthens. The broader structure is still sideways, and the SMA20 slope of -0.15% over 5 days implies short-term pressure remains slightly negative even though the price is not in outright breakdown territory. The absence of a fresh MA-cross matters: it means the market has not yet produced a decisive moving-average signal to confirm a new trend.
There is, however, an important nuance. Trading above the SMA50 while staying below the SMA20 often signals a market in transition rather than one in collapse. In plain English, the medium-term base is still intact, but the short-term recovery has not yet fully earned conviction.
Oscillators & Momentum
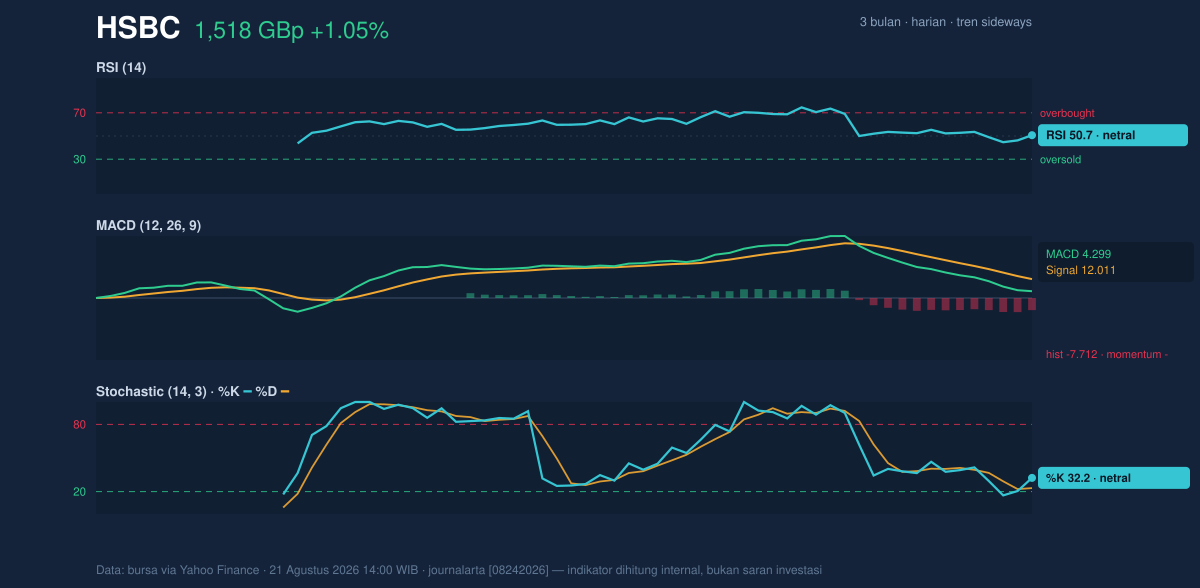
The momentum picture is mixed, and that is exactly why the stock reads as a waiting game rather than a clean trend play. The RSI at 50.7 is neutral, which means the share is neither overbought nor oversold. The Stochastic %K at 32.2 and %D at 23.1 also sits in neutral territory, but it is closer to the lower half of the scale, hinting that recent selling pressure has eased without yet turning into strong upside momentum. In other words, the oscillators do not support a bear case with force, but they also do not confirm a sustained breakout.
The more telling signal comes from MACD. With MACD at 4.299, signal at 12.011, and a histogram of -7.712, the momentum gauge is still negative. The histogram below zero means the faster trend line remains behind the slower signal line, a setup that usually reflects fading upside energy or an incomplete rebound. So while the price has nudged higher on the day, the momentum engine has not fully turned.
Volatility & Volume
The Bollinger Bands point to compression rather than expansion. The upper band sits at 1,593.66, the middle band at 1,537.96, and the lower band at 1,482.26, with %B at 32% and band width at 7.2%. A narrow band width often means volatility has been squeezed out of the stock, which can precede a sharper move once traders commit. Because the price is below the middle band, the immediate bias remains restrained, but the squeeze raises the odds that the next significant move could be more decisive than recent day-to-day drift.
Volume does not yet provide strong confirmation. Last volume was 18,769,794, below the 20-hour average of 28,399,892, or about 0.7x normal. That matters because breakouts driven by weak participation often fail quickly. Still, the OBV is rising, which is constructive: On-Balance Volume tracks whether money is accumulating over time, and a rising OBV while price is consolidating can mean buyers are quietly stepping in even if the headline volume is not impressive. The mix suggests accumulation may be present, but not yet forceful enough to override the negative MACD reading.
Key Levels & Scenarios
The immediate map is clear. Support at 1,497.20 is the first line to watch; it sits close to the SMA50 at 1,491.59, so a break there would not just be a technical slip, it would also threaten the medium-term base that has been holding the stock up. On the upside, resistance at 1,597.40 overlaps closely with the upper Bollinger band at 1,593.66, making that area the first real test of whether the squeeze is resolving higher. The stock’s 3-month high at 1,610.00 is the next reference point beyond resistance; clearing that zone would indicate the market is leaving the recent range behind. The 3-month low at 1,267.20 remains far below current trading and frames the larger base that has already been built.
If price holds above 1,497.20 and reclaims the 1,537.96 SMA20, the chart would start to look less defensive and more constructive. If it loses 1,491.59, the tone shifts toward a deeper pullback, especially given the still-negative MACD.
Technical Verdict: HOLD (wait & see)
HOLD (wait & see) fits the current setup because the stock is sitting between conflicting signals: price above the SMA50 but below the SMA20, RSI at 50.7 and Stochastic 32.2 / 23.1 both neutral, while MACD remains negative. The narrow Bollinger band width of 7.2% also suggests a breakout may be approaching, but direction is not yet confirmed. OBV rising is constructive, yet the latest volume is only 0.7x normal, so participation is not strong enough to call a decisive turn.
- Ideal entry range: 1,497.20 to 1,537.96
- Exit target: 1,593.66 to 1,597.40
- Stop loss protection: below 1,491.59
The verdict is invalidated if price breaks below 1,491.59, because that would put the stock under the 50-day average and weaken the current base.
For non-traders: HSBC is not showing a clear trend yet, but it is also not showing a breakdown.
HSBC’s 3-month high stands at 1,610.00.
Summary Data HSBC
| Last price | 1,518.40 GBp |
| Change 1 day / 5 days / 1 month | 1.05% / -0.62% / -2.22% |
| Trend / MA-cross | sideways / none |
| SMA20 / SMA50 | 1,537.96 / 1,491.59 |
| RSI (14) / Stochastic %K | 50.7 / 32.2 |
| Bollinger %B / ATR | 32% / 30.39 |
| Support / Resistance 20 days | 1,497.20 / 1,597.40 |
| Data as of | 21 Agustus 2026 14:00 WIB |
Track HSBC share price daily: live levels, support/resistance and our full HSBC analysis history.