Momentum Weakens, NKE Stock Gains 1.37% Today
On Agustus 24, 2026: price 40.76 USD, trend downtrend, RSI 46.0, support 39.09, resistance 43.22. technical analysis of nke stock. Momentum Weakens — full…
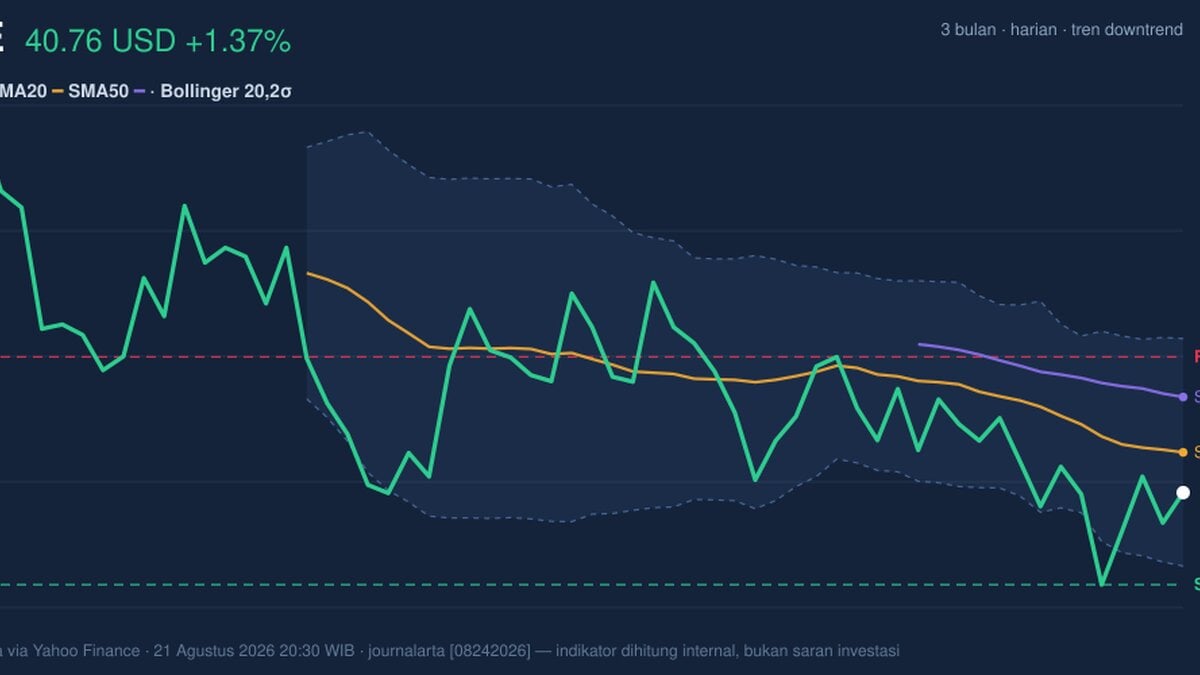
Nike’s shares on the NYSE rose to 40.76 USD, up 1.37% from the previous close of 40.21 USD, but the move still sits inside a broader weakening pattern. The stock remains below both the 20-day moving average at 41.49 and the 50-day moving average at 42.49, which matters because it shows the recent bounce has not yet changed the larger direction. In plain terms, buyers showed up for the day, but they have not yet reclaimed the technical ground that would signal a cleaner recovery.
Trend & Price Action
The chart shows Nike trading in a downtrend, with the SMA20 sloping down 1.21% over the past 5 days. That slope is important: a falling short-term average usually means recent prices are still weaker than earlier ones, so each rally tends to meet sellers sooner than it would in an uptrend. The fact that the share price is below the SMA20 and also below the SMA50 means momentum has not yet crossed back into a constructive zone. There is also no fresh MA-cross, so the chart does not show a new trend reversal signal.
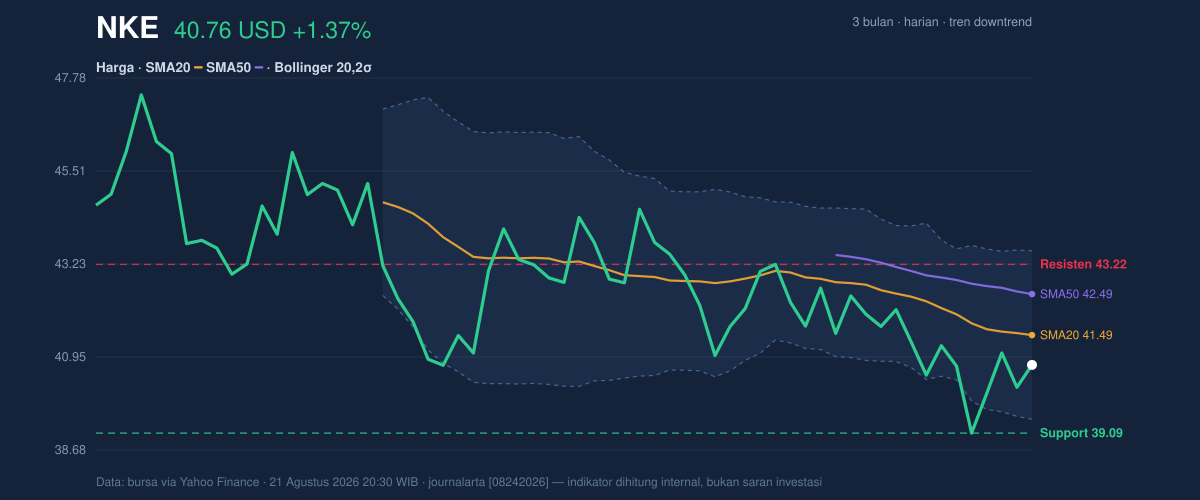
Price is sitting at roughly 40% of the 20-hour range, with 20-hour support at 39.09 and 20-hour resistance at 43.22. That positioning is neutral-to-soft: it is above the lower boundary, but not close enough to resistance to suggest a breakout attempt is already underway. The stock’s 3-month low of 38.86 is not far below current trading, while the 3-month high of 47.65 remains a much higher ceiling. That spread tells readers the market has already repriced Nike lower, and the current debate is whether the recent rebound is just a pause or the start of a base.
A small bounce, not a trend change.
Oscillators & Momentum
The momentum gauges are showing a market that is neither oversold enough to force a reflex rally nor strong enough to confirm a durable turn. The RSI at 46.0 is neutral, which means the stock is not stretched to either extreme. That matters because RSI near 50 often describes indecision: the selling pressure has eased, but buyers have not taken control. The Stochastic %K at 50.3 and %D at 43.9 are also neutral, suggesting the stock is moving sideways within a broad soft patch rather than launching a new impulse.
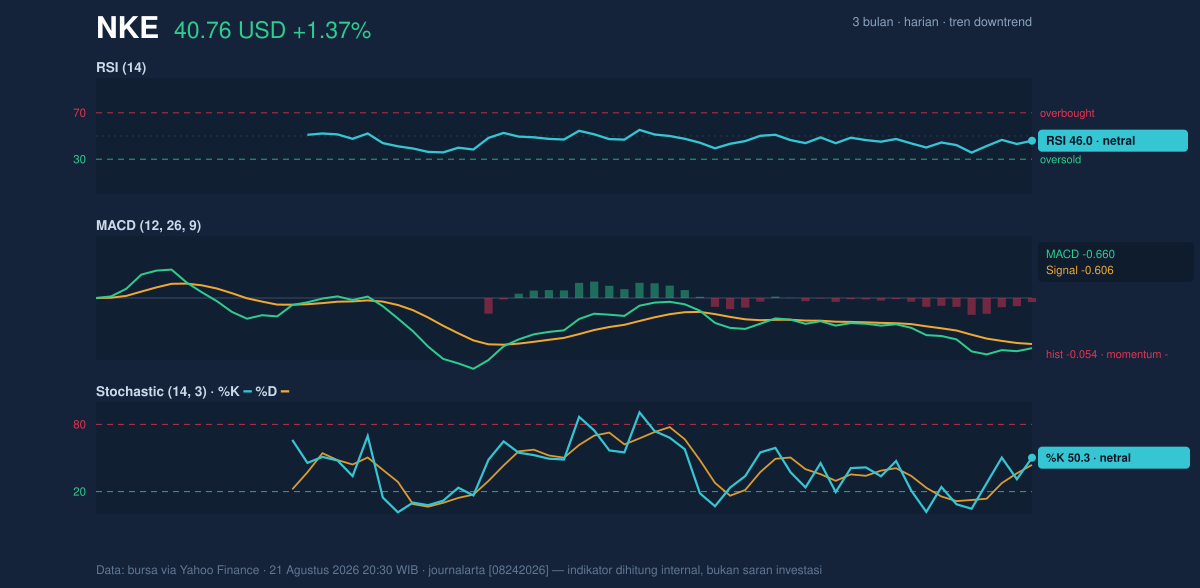
The more cautionary signal comes from MACD. Nike’s MACD is -0.660, below the signal line at -0.606, with a histogram of -0.054. In simple terms, MACD measures whether shorter-term price movement is improving faster than longer-term movement; when it stays negative and below the signal line, the market is still losing momentum, even if the daily price has risen. The small gap between MACD and signal suggests the weakness is not collapsing, but it is still present. That is a “less bad” setup, not a clear bullish one.
Volatility & Volume
Bollinger Bands help show where the price sits relative to its recent trading envelope. Nike’s %B at 32% means the stock is trading in the lower third of the band structure, closer to the bottom than the middle. With the lower band at 39.43 and the middle band at 41.49, the market is still pressing against the weaker half of the range. The 9.9% band width is described as normal, so this is not a volatility squeeze that often precedes a sharp move; it is more of a standard trading environment.
The ATR(14) at 1.15, equal to 2.8% of price, points to moderate day-to-day movement. That means the stock can still travel meaningfully, but not in a highly erratic way. Volume, however, is a softer note: the latest 14,691,100 shares traded versus a 20-day average of 24,056,390, or 0.6× normal. Lower-than-average participation makes the day’s gain less convincing because price moves tend to matter more when they are backed by heavier trading. The OBV is falling, which reinforces that the broader flow of money has not yet turned supportive. OBV, or on-balance volume, is a cumulative gauge that often rises when buyers are steadily accumulating; here, it says the opposite.
Quiet bounce, weak participation.
Key Levels & Scenarios
The nearest technical floor is the 39.09 support, with the 39.43 Bollinger lower band close by. If the stock holds above that zone, it would keep the current range intact and preserve the possibility of a move back toward the middle band at 41.49. A stronger recovery would need to clear the 41.49 SMA20 first, then challenge the 42.49 SMA50 and the 43.22 resistance. That sequence matters because each level represents a different layer of seller memory: moving through them would show that demand is absorbing supply rather than merely bouncing.
If price slips back below 39.09, the chart would start leaning toward a retest of the 38.86 3-month low. That would not automatically mean a breakdown, but it would signal that the recent rebound failed to hold the lower end of the range. If instead Nike can reclaim 41.49 on better participation, the tone improves because the stock would be back above the short-term trend marker and the Bollinger midpoint at the same time.
Technical Verdict: HOLD (wait & see)
- The price is below the SMA20 and SMA50, so the trend still leans down.
- RSI 46.0 and Stochastic 50.3/43.9 are neutral, while MACD remains negative, which means momentum has not confirmed a reversal.
- Volume is 0.6× normal and OBV is falling, so the day’s rebound lacks strong participation.
- Ideal entry range: 39.43 to 41.49 USD, where the lower Bollinger band and SMA20 define the current decision zone.
- Exit target: 42.49 to 43.22 USD, using the SMA50 and 20-hour resistance as the first recovery checkpoints.
- Stop loss protection: below 39.09 USD, with added caution if the stock loses 38.86 USD.
Verdict invalidated if price breaks below 39.09 USD.
For non-traders: Nike is trying to stabilize, but the chart still needs stronger proof before the rebound can be treated as anything more than a pause.
“Until the stock can reclaim its moving averages with real volume, this is still a market asking for proof.”
Summary Data NKE
| Last price | 40.76 USD |
| Change 1 day / 5 days / 1 month | 1.37% / 0.07% / -2.25% |
| Trend / MA-cross | downtrend / none |
| SMA20 / SMA50 | 41.49 / 42.49 |
| RSI (14) / Stochastic %K | 46.0 / 50.3 |
| Bollinger %B / ATR | 32% / 1.15 |
| Support / Resistance 20 days | 39.09 / 43.22 |
| Data as of | 21 Agustus 2026 20:30 WIB |
Track NKE stock price daily: live levels, support/resistance and our full NKE analysis history.