On Agustus 24, 2026: price 152.55 USD, trend uptrend, RSI 77.7, support 127.77, resistance 152.55. technical analysis of mrk stock. MRK Stock Analysis — full…
By Elena Vance
August 24, 20265 min read
MRK Stock Analysis
Merck is pressing against the top of its recent trading range, a move that has lifted the stock 1 day 2.39% to 152.55 USD and pushed it to 100% of its 20-hour range, according to Yahoo Finance data cited on 21 August 2026 at 20:30 WIB. For international investors, the key question is not whether the shares are rising — they are — but whether the move is being driven by durable buying or by a short-term momentum burst that is already stretched.
Trend & Price Action
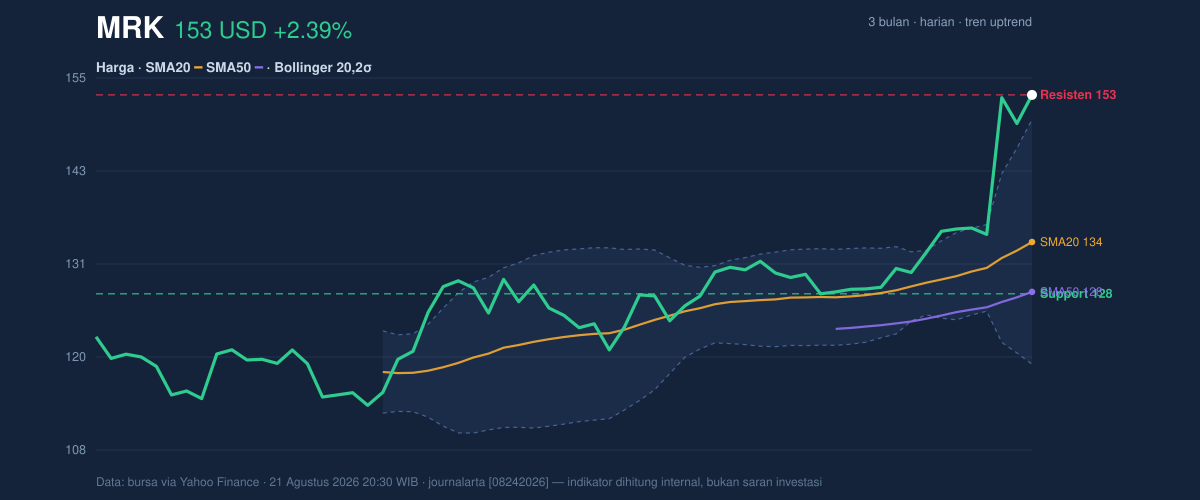
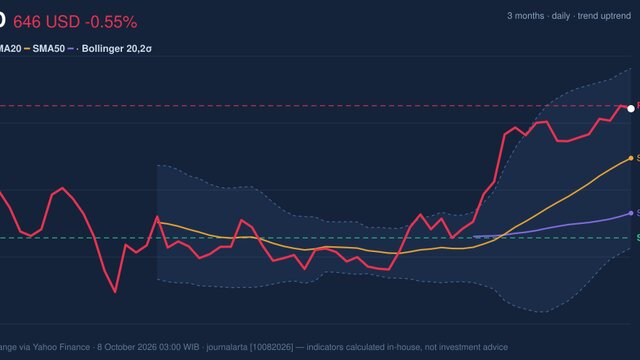
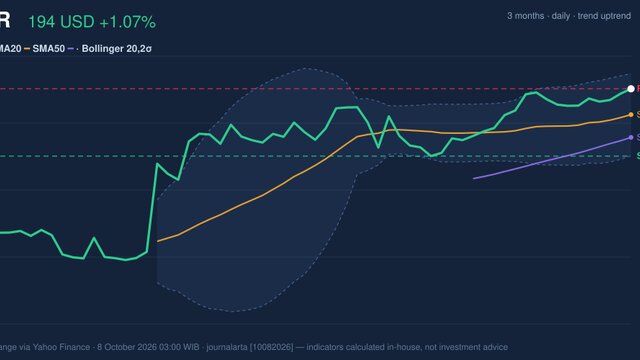
Merck’s chart shows a clear upward structure: the share price is trading well above SMA20 at 134.23 and SMA50 at 128.00, while the SMA20 slope of 3.28% over 5 days confirms that the short-term trend is still rising. In plain terms, the stock is not simply bouncing inside a sideways band; it has been gaining altitude with the moving average itself turning higher, which usually signals that recent demand has been persistent rather than one-off. The absence of a fresh MA-cross matters too: there is no new crossover to mark the beginning of the trend, but the existing alignment still favors the bulls because price remains above both averages.
The price is also sitting near the top of its 3-month corridor, with the 3-month high at 154.49 only slightly above the latest print and the 3-month low at 111.57 far below. That tells readers the stock has already done most of the work in reclaiming its range. Momentum has not merely recovered — it has become extended.
3-month price action chart of MRK: price, SMA20/50, Bollinger, support & resistance. Data: exchange via Yahoo Finance.
A short line is enough here: the chart shows strength, but also proximity to a ceiling.
Oscillators & Momentum
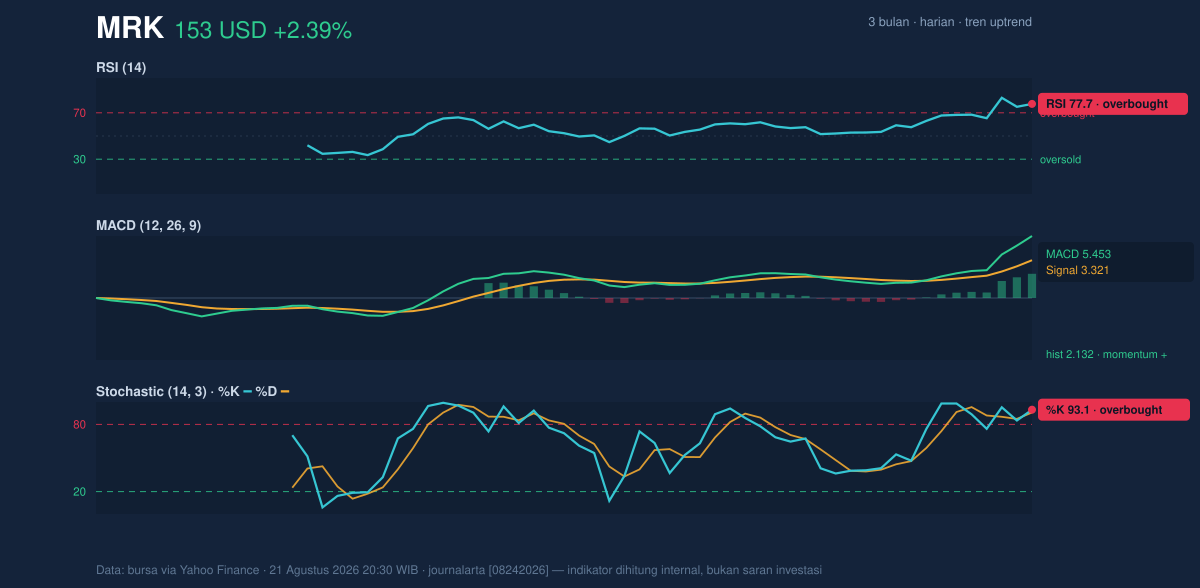
The momentum picture is powerful but increasingly stretched. RSI at 77.7 and Stochastic %K at 93.1 / %D at 90.6 both sit in overbought territory, which means the stock has risen so quickly that it may be vulnerable to pauses or pullbacks. “Overbought” does not mean the shares must fall immediately; it means the pace of buying has outrun the usual rhythm of the market, so even good news may produce less incremental upside than before. For a stock like Merck, that often translates into a period of consolidation rather than a straight-line continuation.
At the same time, the MACD at 5.453 remains above its signal line at 3.321, and the histogram at 2.132 shows the bullish momentum is still positive. This is the important nuance: oscillators are warning that the move is hot, but MACD says the trend has not yet rolled over. In other words, the stock is overextended, not broken.
Momentum chart of MRK: RSI(14), MACD, Stochastic. Data: exchange via Yahoo Finance.
The signal is simple: strength is intact, but it is no longer cheap momentum.
Volatility & Volume
The Bollinger setup reinforces that tension. With the upper band at 149.47 and price at 152.55, Merck is trading above the top of its normal 20-day volatility envelope, while %B at 110% indicates the share price has moved beyond the usual band. That often happens during strong breakouts, but it also raises the odds of mean reversion because prices outside the band tend to be harder to sustain without fresh catalysts. The Bollinger width of 22.7% shows the bands are expanding, a sign that volatility is rising rather than compressing. Expanding bands usually accompany trend continuation, but they can also mark a market that is becoming less forgiving.
The volume and participation data are more supportive. Last volume came in at 15,961,400, about 1.5× the 20-hour average of 10,520,810, and OBV is rising. That combination matters because price gains backed by heavier trading and rising on-balance volume tend to be more credible than gains made on thin activity. In simple terms, more market participants appear to be joining the move, which reduces the chance that the rally is purely mechanical.
Still, the stock is also carrying ATR(14) of 4.50, about 2.9% of price, which means daily swings can remain meaningful even without a broad market shock. The tape is active, not calm.
Key Levels & Scenarios
The nearest reference points are unusually tight after the recent run. The chart places support at 127.77 and resistance at 152.55, with price already at the resistance edge and just under the 3-month high of 154.49. That makes the current zone important: a clean hold above the recent breakout area would suggest continuation, while failure back below the support band would imply the move has lost traction.
If Merck can stay above the upper range and convert 152.55 into a base, the next test is the 154.49 high. If it cannot, the first meaningful area to watch is 127.77, which is the level that would show the breakout has failed and the stock has slipped back into its prior trading zone. Because the shares are already above the Bollinger upper band, any retreat could be swift if momentum cools.
Technical Verdict: HOLD (wait & see)
HOLD (wait & see) is the cleanest reading from the indicators: the trend is strong, but the stock is also stretched.
- RSI at 77.7 and Stochastic at 93.1 / 90.6 flag an overbought condition, which raises the risk of near-term consolidation.
- MACD at 5.453 above signal 3.321 still supports the uptrend, so the move has not yet reversed.
- Price above SMA20 134.23 and SMA50 128.00, plus rising OBV and 1.5× volume, show the rally has real participation.
- Verdict invalidated if price falls below 127.77, which would signal the breakout has failed and the stock has returned to its prior range.
- Ideal Entry Range: 127.77 to 134.23
- Exit Target (Target Price): 154.49
- Stop Loss protection: below 127.77
For non-traders, this means Merck is still trending higher, but the stock has already run fast enough that patience matters more than chasing the move.