OCBC Stock Analysis: Gains 0.65%, Momentum Weakens
On Agustus 24, 2026: price 30.98 SGD, trend uptrend, RSI 65.3, support 28.63, resistance 31.79. technical analysis of ocbc stock. OCBC Stock Analysis — full…
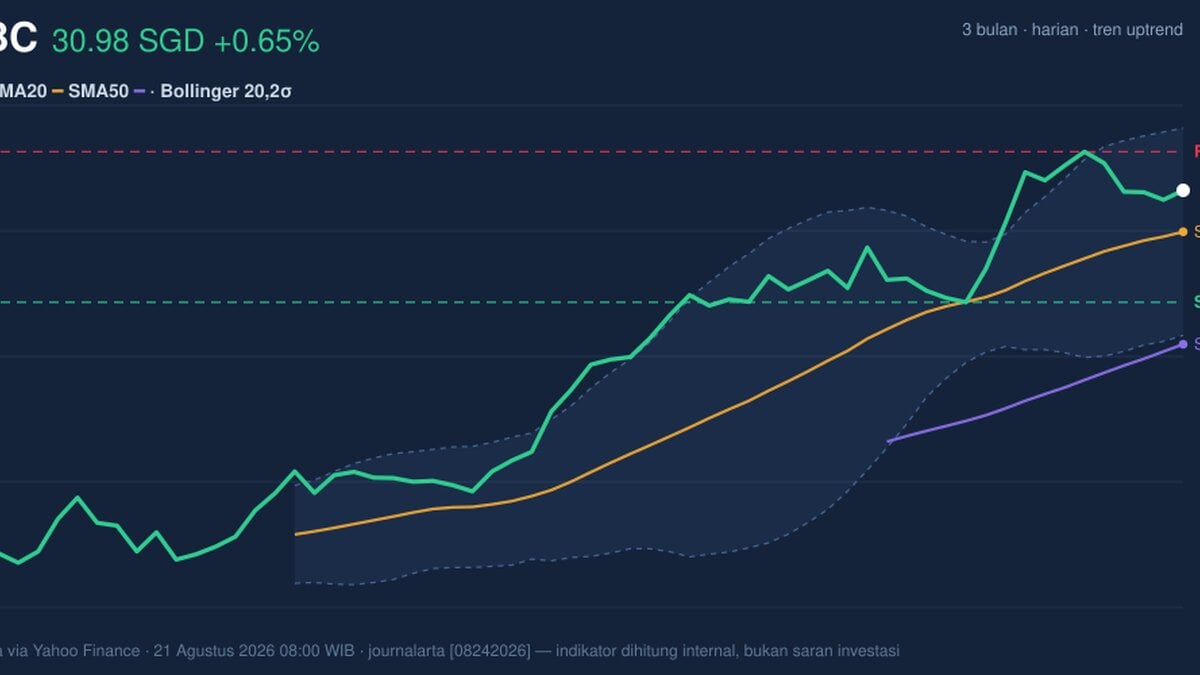
OCBC Bank’s shares on SGX edged up to 30.98 SGD from 30.78 SGD, but the tape is telling a more nuanced story than the day’s gain alone. The stock remains in an uptrend, sitting above the SMA20 at 30.11 and well clear of the SMA50 at 27.75, yet the latest momentum reading is softer than the price action suggests. That mix matters: it often means the larger trend is still intact, but the pace of the advance is no longer accelerating.
Trend & Price Action
The broader structure still favours the bulls. OCBC is trading in the upper part of its recent range, with price at about 74% of the 20-hour range and only a little below the 20-hour resistance at 31.79. The stock is also close to its 3-month high of 31.86, which signals that buyers have been willing to defend the name near recent peaks rather than allowing a deeper retracement.
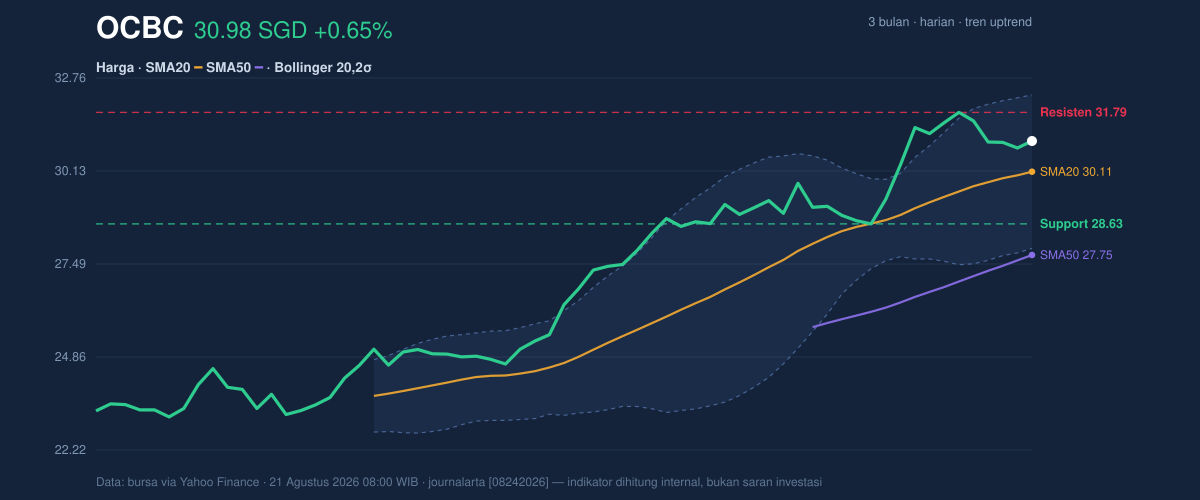
The important signal here is not just that OCBC is above its moving averages, but that the SMA20 is rising, with a 1.90% slope over 5 days. A rising short-term average usually means recent buying has been strong enough to pull the trendline higher. There is no new MA cross, though, so the move is being driven by price staying above the averages rather than by a fresh trend ignition. In plain terms: the trend is healthy, but not newly confirmed by a crossover event.
The 1-month gain of 7.20% also shows that the stock has already done a fair amount of work. That can be constructive in a strong market, but it also raises the odds of pauses as traders lock in gains near resistance.
Oscillators & Momentum
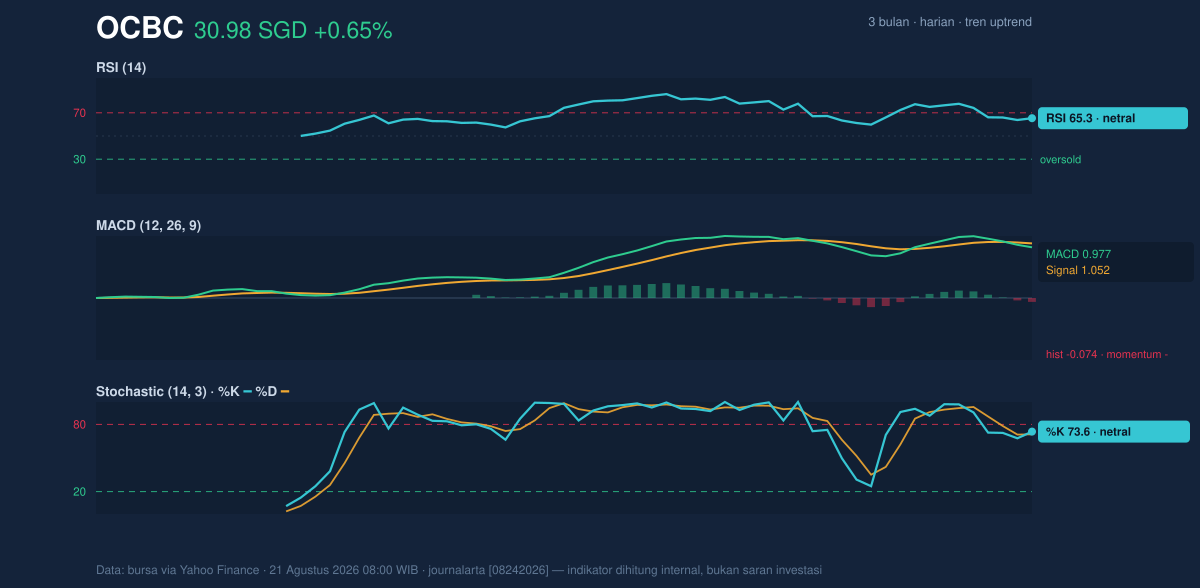
The oscillators are leaning neutral rather than enthusiastic. RSI at 65.3 sits in a zone that is neither oversold nor fully stretched, but it is close enough to the upper end to suggest the stock is no longer early in a rebound. Stochastic %K at 73.6 and %D at 71.2 also point to a firm but not explosive momentum profile. In practical terms, these readings say the share price is still being supported, yet the immediate upside may require fresh buying interest rather than simple trend-following.
The more cautionary signal comes from MACD. The MACD at 0.977 remains above zero, which usually supports an upward bias, but it is still below the signal line at 1.052, with a negative histogram of -0.074. That combination is important: price can keep rising while MACD weakens, but when the histogram turns negative it often means the rate of ascent is slowing. In other words, the trend has not broken, but momentum is no longer confirming the move as strongly as before.
Volatility & Volume
Volatility is contained rather than dramatic. The Bollinger Bands are in a normal 14.4% width, which suggests the stock is not in a squeeze that often precedes a sharp breakout, nor is it in an expansion phase that would imply disorderly trading. Price is at %B 70%, meaning it is trading in the upper portion of the band structure but still below the upper band at 32.29. That positioning usually indicates constructive pressure without outright overheating.
ATR adds another useful layer. At 0.69, or 2.2% of price, daily movement is moderate. This matters because a stock with medium ATR can drift higher without dramatic candles, but it can also slip back toward the middle band if buyers do not show up consistently.
Volume, however, is not fully endorsing the latest move. Last trade volume of 5,788,200 was only 0.8x normal versus the 20-hour average of 7,021,024. That means the day’s rise came on lighter participation than usual. The OBV is rising, which is a constructive sign because it suggests accumulation has been building over time, but the immediate volume shortfall implies the latest push above the previous close was not backed by especially strong conviction.
Key Levels & Scenarios
The chart shows a fairly clear near-term map. On the downside, 30.11 is the first important reference because it is the SMA20 and also the Bollinger midline. A sustained move below that level would suggest the stock is losing short-term trend support. Below that, 28.63 is the next visible support; if that floor gives way, the recent uptrend would be under clearer pressure.
On the upside, 31.79 is the immediate resistance to watch, with the 3-month high at 31.86 sitting just above it. That narrow gap means the market is already testing the upper boundary of the recent range. A clean move through that zone would signal that OCBC is trying to extend its advance beyond the existing ceiling, while failure there would keep the stock boxed into a consolidation band.
Technical Verdict: HOLD (wait & see)
HOLD (wait & see)
- MACD is still negative versus its signal line, showing momentum is softer than price strength.
- RSI at 65.3 and Stochastic near 70 are constructive but not decisive, so the stock is not in a fresh breakout condition.
- Price above SMA20 and SMA50 keeps the trend positive, but volume at 0.8x normal does not yet confirm a strong continuation move.
Verdict invalidated if price falls below 30.11, because that would mean the stock has slipped under its short-term trend support.
- Ideal Entry Range: 30.11 to 30.98
- Exit Target: 31.79 to 31.86
- Stop Loss protection: below 28.63
For non-traders, this means OCBC still looks steady, but the chart is asking for more proof before the next leg higher. The next scheduled reference is whether price can hold above 30.11 and challenge 31.79 again.
Summary Data OCBC
| Last price | 30.98 SGD |
| Change 1 day / 5 days / 1 month | 0.65% / -2.55% / 7.20% |
| Trend / MA-cross | uptrend / none |
| SMA20 / SMA50 | 30.11 / 27.75 |
| RSI (14) / Stochastic %K | 65.3 / 73.6 |
| Bollinger %B / ATR | 70% / 0.69 |
| Support / Resistance 20 days | 28.63 / 31.79 |
| Data as of | 21 Agustus 2026 08:00 WIB |
Track OCBC share price daily: live levels, support/resistance and our full OCBC analysis history.