ORCL Stock Technicals Today: Gains 3.10%, Momentum Gains
On Agustus 24, 2026: price 146.47 USD, trend sideways, RSI 52.9, support 117.74, resistance 156.22. technical analysis of orcl stock. ORCL Stock Technicals —…
Oracle is trading higher, but the message from the chart is less about breakout euphoria than about a stock trying to stabilize inside a still-widening range. For international readers watching U.S. technology names, the key point is that Oracle’s latest move is supported by positive momentum, yet the broader structure remains only partly repaired after a sharp retreat from earlier highs.
On the New York Stock Exchange, Oracle closed at 146.47 USD, up 3.10% on the day from 142.07, while still sitting below the recent ceiling that has capped advances. The stock is also up 27.38% over one month, but down 2.69% over five days, a combination that usually signals a rebound that has not yet fully convinced short-term traders. In plain terms: the recovery is real, but it is not yet cleanly in charge.
Trend & Price Action
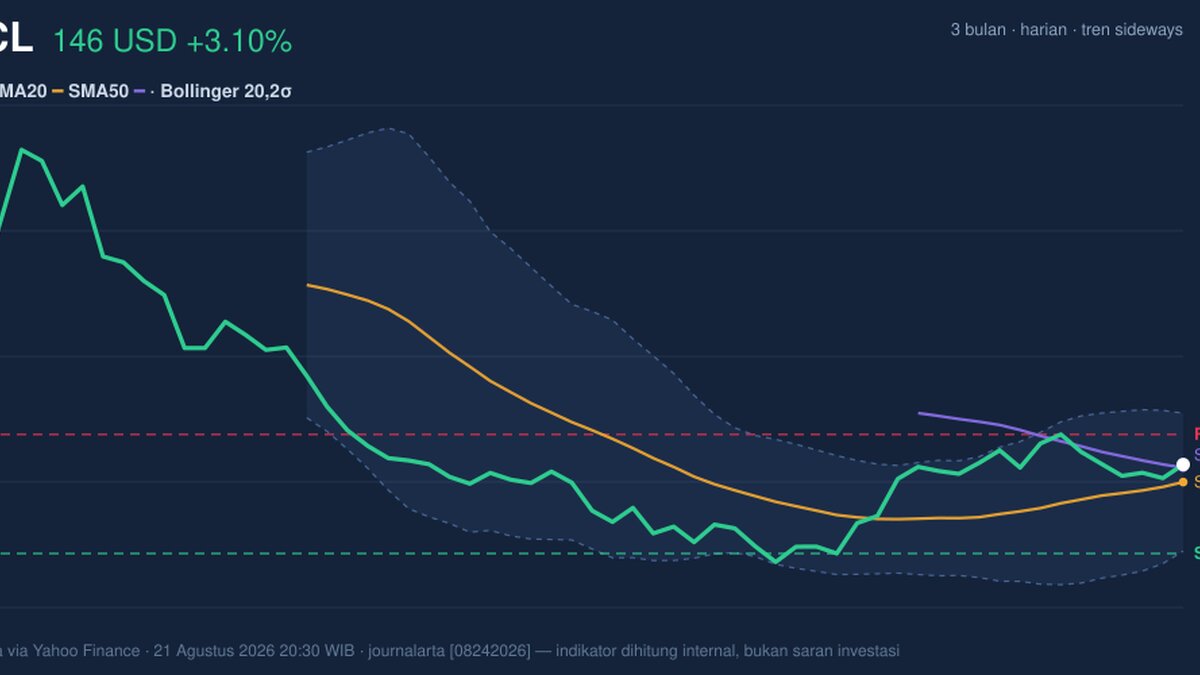
Oracle’s trend is described as sideways, even though the SMA20 at 140.79 is rising with a 4.16% five-day slope. That matters because a rising short-term average tells us recent prices have been improving, but “sideways” means the stock is still moving within a broad consolidation rather than a decisive uptrend. The price is above the SMA20 and just above the SMA50 at 145.43, which is constructive: short-term traders are paying slightly more than the medium-term average, a common sign that buying pressure is present. Still, there is no new MA-cross, so the chart has not produced the classic moving-average confirmation that would usually mark a stronger trend shift.
The broader location also matters. Oracle is trading at about 75% of its 20-hour range, with support at 117.74 and resistance at 156.22. That places the stock closer to the upper half of its recent band, but not at the top. The stock’s 3-month high of 250.25 and 3-month low of 114.50 show how much room the shares have already traveled, and how much work remains before the market can say the prior down move has been fully reversed.
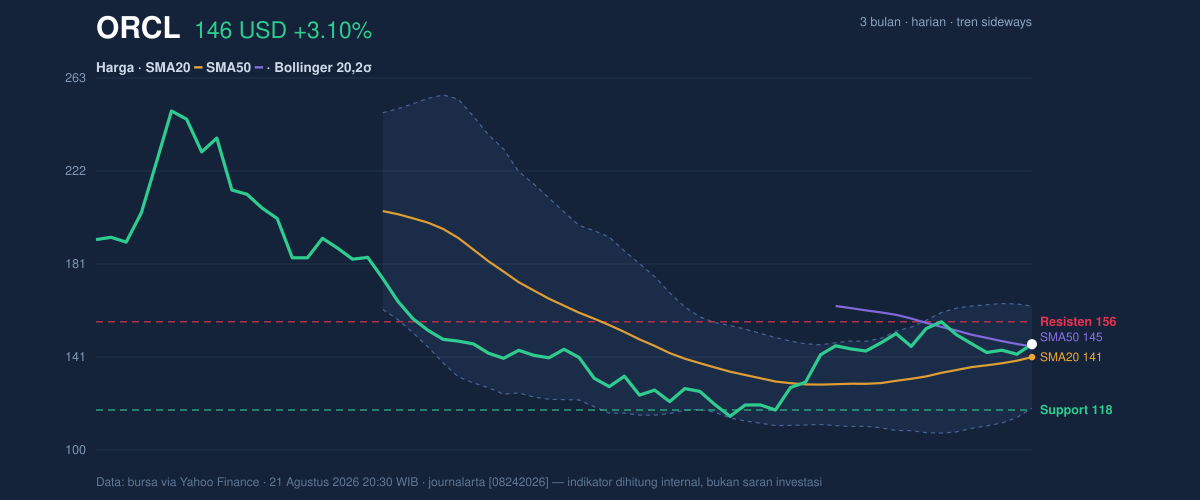
As shown in the chart, the price is above the short-term average but still below the next resistance zone, which means the market is improving without yet proving a full trend reversal.
Oscillators & Momentum
The momentum picture is more supportive than the trend label alone suggests. Oracle’s RSI at 52.9 is neutral, which is important because it says the stock is neither stretched nor washed out. That usually leaves room for the next move to develop without immediate exhaustion risk. The Stochastic %K at 41.4 and %D at 45.4 are also neutral, reinforcing the idea that the stock is not flashing an overbought warning even after the recent one-month rise. The key positive signal comes from the MACD at 1.138 versus its signal line at 0.227, with a histogram of 0.911. In practical terms, MACD measures whether recent price action is gaining speed relative to its trend; when the MACD line sits above the signal line and the histogram is positive, it suggests upside momentum is still in place.
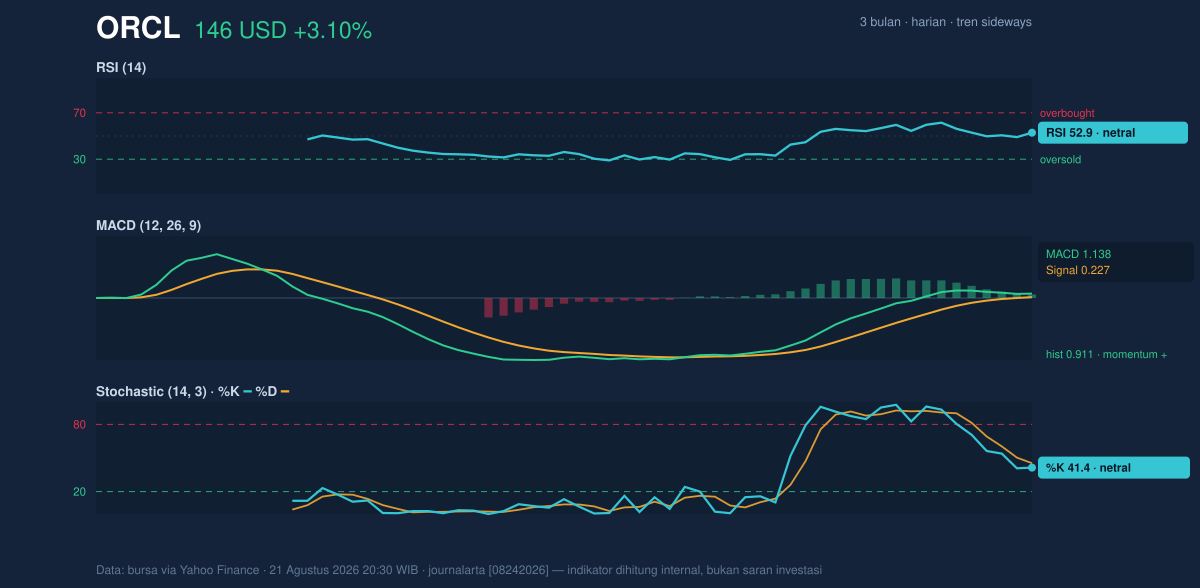
RSI is neutral, Stochastic is neutral, and MACD is positive — a combination that points to improving momentum without an overbought warning.
Volatility & Volume
Volatility is elevated, and that changes how investors should read each move. Oracle’s Bollinger Bands are wide, with the upper band at 163.05 and the lower band at 118.53, while the band width is 31.6% and described as expanding. A widening band usually means the stock is entering a more active phase after a quieter period, so price swings can become larger in both directions. The stock’s %B of 63% places it above the middle of the band but not near the top, which suggests room for further upside before the price starts looking extended relative to its recent volatility envelope.
Volume is the caution flag. The latest trading volume was 19,567,800, below the 20-hour average of 29,084,490, or about 0.7× normal. That means the day’s advance did not come with full participation from the broader market. Yet OBV is rising, and that matters because On-Balance Volume tracks whether volume tends to accumulate on up days. Rising OBV alongside a higher price often indicates quiet accumulation, even if the latest session itself was not especially busy.
The move is backed by positive accumulation signals, but the below-average turnover means the rally still needs broader participation to look durable.
Key Levels & Scenarios
The chart’s immediate battleground is clear. Resistance at 156.22 is the first level that would need to give way for the current rebound to look more convincing, while support at 117.74 remains the major floor from the 20-hour range. The Bollinger framework adds another reference point: the upper band at 163.05 sits above resistance, suggesting that if price pushes through the near-term ceiling, the market could begin testing the upper volatility envelope rather than simply oscillating inside it. On the downside, the SMA20 at 140.79 and SMA50 at 145.43 are important because they sit close to the current price and can act as dynamic support if sellers reappear.
If Oracle clears 156.22, the next test is the 163.05 upper Bollinger band; if it slips back below 145.43 or 140.79, the rebound starts to lose shape.
Technical Verdict: HOLD (wait & see)
- Reason 1: MACD is positive and the histogram remains above zero, which supports the current rebound.
- Reason 2: RSI at 52.9 and Stochastic at 41.4/45.4 are neutral, meaning there is no overbought pressure, but also no strong momentum breakout signal yet.
- Reason 3: The stock is above SMA20 at 140.79 and near SMA50 at 145.43, but there is no new MA-cross and volume is only 0.7× normal.
- Invalidation: This verdict is invalidated if price breaks below 140.79, the SMA20, where short-term support would begin to fail.
- Ideal Entry Range: 140.79–145.43 USD, where the SMA20 and SMA50 cluster.
- Exit Target: 156.22 USD, with the 163.05 Bollinger upper band as the next technical reference.
- Stop Loss protection: 117.74 USD, the 20-hour support floor; a deeper failure would expose the 118.53 lower Bollinger band.
For non-traders, that means Oracle looks improved, but the chart still wants proof before calling the move durable.
“The market is giving Oracle credit for recovery, but it is still asking for confirmation.”
Summary Data ORCL
| Last price | 146.47 USD |
| Change 1 day / 5 days / 1 month | 3.10% / -2.69% / 27.38% |
| Trend / MA-cross | sideways / none |
| SMA20 / SMA50 | 140.79 / 145.43 |
| RSI (14) / Stochastic %K | 52.9 / 41.4 |
| Bollinger %B / ATR | 63% / 6.49 |
| Support / Resistance 20 days | 117.74 / 156.22 |
| Data as of | 21 Agustus 2026 20:30 WIB |
Track ORCL stock price daily: live levels, support/resistance and our full ORCL analysis history.