Tencent Stock Gains 1.24% Today, Momentum Weakens
On Agustus 24, 2026: price 457.00 HKD, trend sideways, RSI 49.4, support 440.00, resistance 492.20. technical analysis of tencent stock.
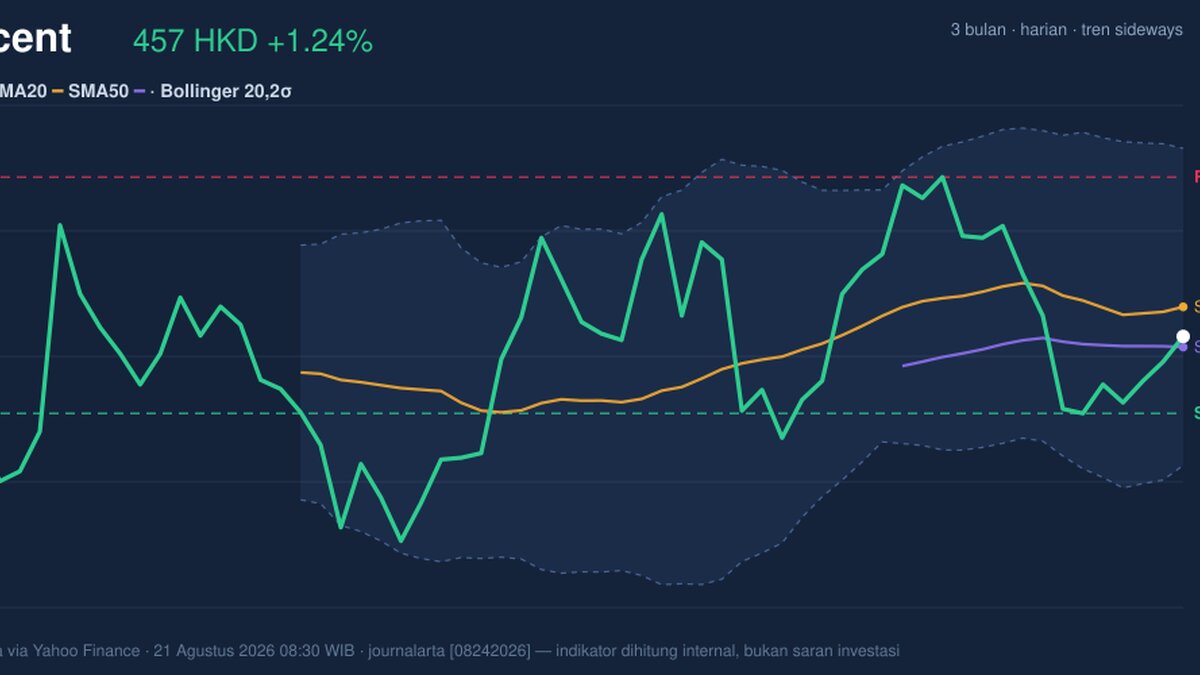
Tencent Holdings slipped back on the Hong Kong exchange, with 0700.HK last at HKD 457.00 after a 1-day gain of 1.24%, but the move sits inside a broader sideways pattern rather than a clean breakout, according to data from Yahoo Finance at 21 August 2026 08:30 WIB. The key signal is not the daily bounce itself; it is that the stock remains below its SMA20 at HKD 463.55 while SMA50 at HKD 454.66 is still underneath price, a configuration that often points to a market searching for direction rather than one with a strong trend. The chart also shows Tencent trading in the middle of its recent range, with momentum and volume offering only limited confirmation.
Trend & Price Action
Tencent’s price structure is best described as sideways, with the SMA20 slope at -0.30% over 5 days indicating a mild loss of short-term traction. That matters because a flattening or gently falling short-term average often means buyers are no longer pressing aggressively enough to lift price away from the mean. At the same time, the share price is still above SMA50 at HKD 454.66, which keeps the medium-term picture from turning outright weak. In practical terms, the stock is sitting between two moving averages that are close together, a sign of compression rather than conviction.
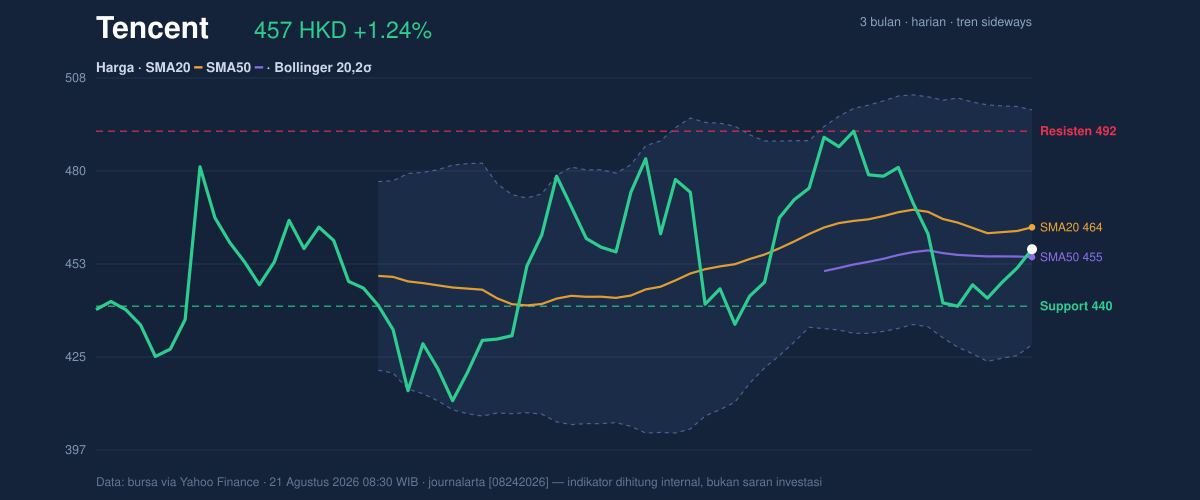
The 3-month range adds context: Tencent has traded between HKD 411.00 and HKD 497.80, and the latest close sits well inside that band. The 20-hour support at HKD 440.00 and resistance at HKD 492.20 frame the current market as range-bound, with price positioned at about 33% of that span. That placement suggests the stock is not under severe stress, but neither is it close to testing the upper edge of the range where trend followers would usually want to see follow-through.
One line says it all: the market is waiting.
Oscillators & Momentum
The momentum picture is mixed to weak. RSI at 49.4 is neutral, which means the stock is neither stretched into overbought territory nor washed out into oversold conditions. That neutrality matters because it leaves room for movement in either direction, but it also confirms that recent price action has not built a strong directional push. Stochastic %K at 34.0 and %D at 25.7 also sit in neutral territory, with the fast line only slightly above the slower one. This is not the kind of crossover that usually signals a decisive turn; it looks more like a tentative stabilization after weakness.
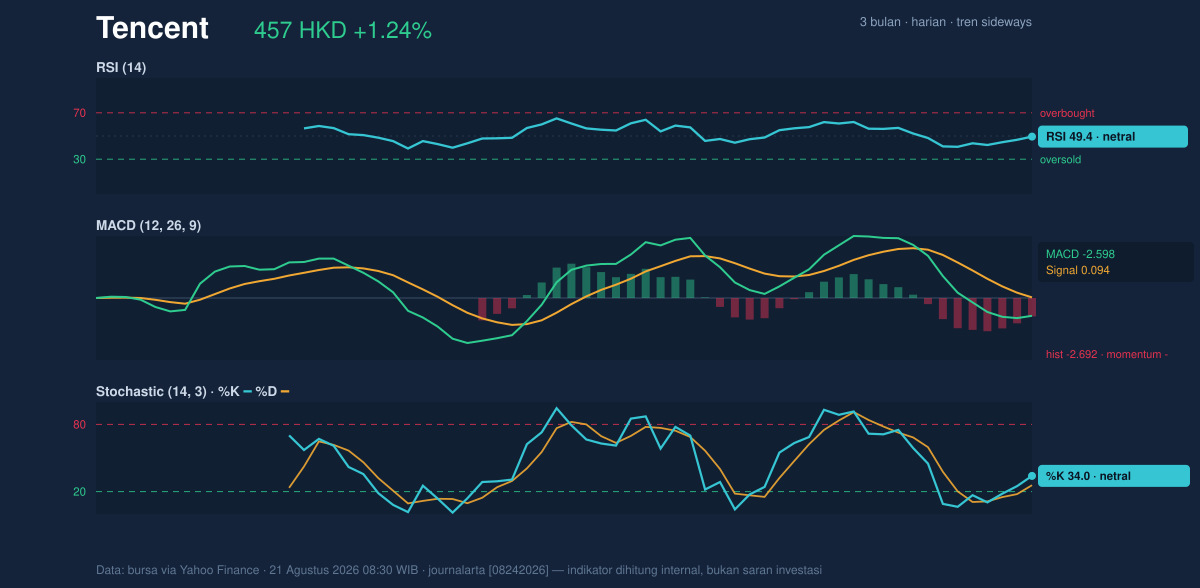
The more important warning comes from MACD at -2.598, with the signal line at 0.094 and the histogram at -2.692. MACD measures whether short-term momentum is outrunning longer-term momentum; here, it is not. The negative histogram shows bearish momentum still dominates even though price has recovered from the previous close. In plain language, the stock can bounce without yet proving that sellers are done.
Volatility & Volume
Volatility is contained rather than explosive. Bollinger Bands show the upper band at HKD 498.58, middle band at HKD 463.55, and lower band at HKD 428.52, with %B at 41% and band width at 15.1%, described as normal. That combination usually means the stock is not in a squeeze that would precede a violent move, nor is it already riding the top of the channel. Price sitting below the middle band but above the lower band often signals a market that is still digesting prior weakness.
Volume does not yet confirm a stronger turn. Last volume was 22,326,906, below the 20-session average of 26,172,838, or 0.9x normal, while OBV is falling. OBV, or on-balance volume, tracks whether trading activity is supporting price gains or losses. A declining OBV alongside a modest price rebound suggests the latest lift may not be backed by broad accumulation. That is an important distinction: a stock can rise on light volume, but such moves are often fragile unless participation improves.
Key Levels & Scenarios
The immediate map is clear. HKD 440.00 is the first support to watch, followed by the Bollinger lower band at HKD 428.52. On the upside, HKD 463.55 — the SMA20 and Bollinger middle band — is the first technical hurdle, then HKD 492.20 resistance, with the 3-month high at HKD 497.80 sitting just above it.
If price can reclaim and hold above HKD 463.55, that would improve the tone by putting Tencent back above its short-term average and nearer the upper half of the range. If it fails to hold HKD 440.00, the chart would lose an important floor and expose the lower Bollinger band at HKD 428.52. The current setup therefore hinges on whether the stock can convert a mild bounce into a move that attracts volume and lifts momentum.
Technical Verdict: HOLD (wait & see)
HOLD (wait & see) is the cleanest reading because the chart shows mixed signals: price is below SMA20, MACD remains negative, and volume/OBV do not confirm strength, even though SMA50 is still underneath price and RSI/Stochastic are neutral rather than oversold. The verdict is invalidated if price breaks below HKD 440.00, because that would weaken the current range floor and increase downside pressure toward the lower Bollinger band.
- Ideal Entry Range: HKD 440.00 to 454.66
- Exit Target (Target Price): HKD 463.55 first, then 492.20 if momentum improves
- Stop Loss protection: below 428.52
In plain English, Tencent is not showing enough technical strength to call a decisive move, but it is also not breaking down yet.
“Until volume and momentum turn together, this is a market that still wants proof.”
Summary Data Tencent
| Last price | 457.00 HKD |
| Change 1 day / 5 days / 1 month | 1.24% / 3.86% / 5.15% |
| Trend / MA-cross | sideways / none |
| SMA20 / SMA50 | 463.55 / 454.66 |
| RSI (14) / Stochastic %K | 49.4 / 34.0 |
| Bollinger %B / ATR | 41% / 12.17 |
| Support / Resistance 20 days | 440.00 / 492.20 |
| Data as of | 21 Agustus 2026 08:30 WIB |
Track Tencent share price daily: live levels, support/resistance and our full Tencent analysis history.