Testing Key Resistance, Shell Stock Drops 0.89% Today
On Agustus 24, 2026: price 3,409.50 GBp, trend uptrend, RSI 61.2, support 3,234.50, resistance 3,440.00. technical analysis of shell stock.
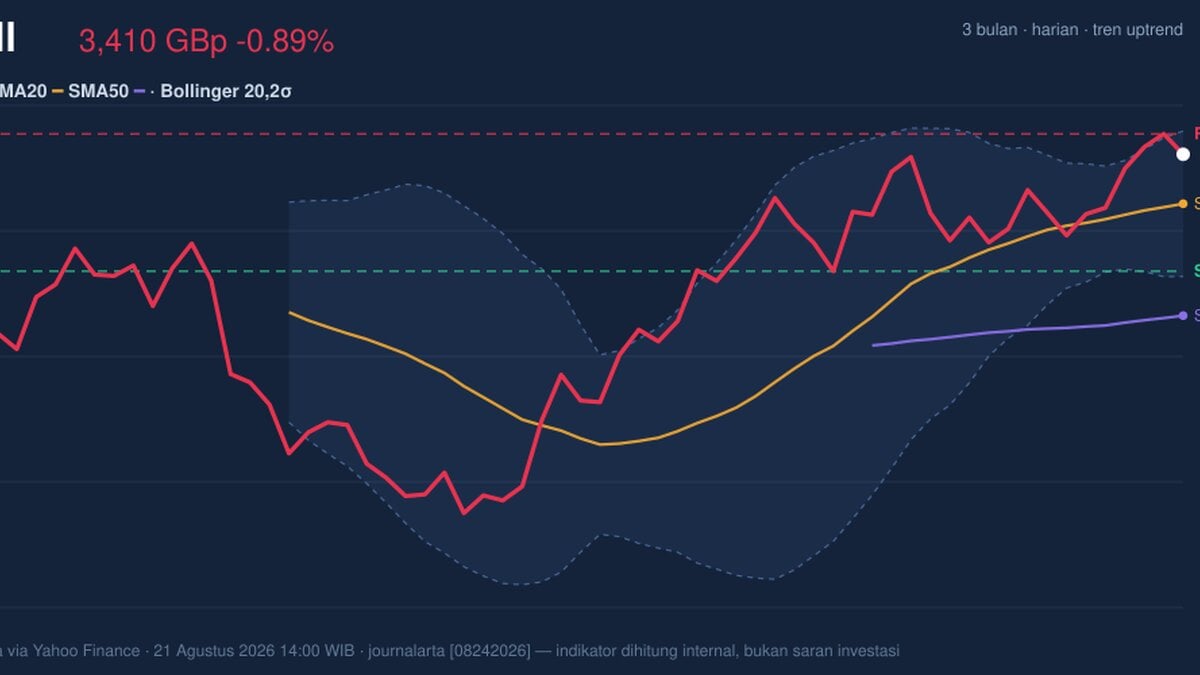
Shell plc edged lower on the London Stock Exchange on 21 August 2026, with the shares last changing hands at 3,409.50 GBp, down 0.89% on the day even as the broader short-term structure remains constructive. The pullback matters less for the size of the move than for where it happened: the stock is still trading above its short-term average, volume is running above normal, and momentum indicators are not yet showing the kind of breakdown that usually marks a trend failure.
Trend & Price Action
Shell is still in an uptrend, and the chart shows why. The share price sits above the SMA20 at 3,335.48 and comfortably above the SMA50 at 3,168.15, which tells investors the medium-term trend is still pointing higher and that recent weakness has not yet damaged the larger structure. There is no fresh MA-cross, so the market is not flashing a new trend reversal signal; instead, it is digesting gains after a run that has left the stock near the upper end of its recent range.
That positioning is important. The price is trading at about 85% of the 20-hour range, with the 3,440.00 area acting as immediate resistance and the 3,234.50 zone as support, according to the exchange data. In plain terms, Shell is close enough to the top of the range to suggest buyers have been active, but not so extended that the chart looks exhausted. The 3-month range, from 2,559.50 to 3,758.50, also shows the stock has already recovered a large part of its earlier drawdown, which makes the current level more about consolidation than a fresh escape attempt.
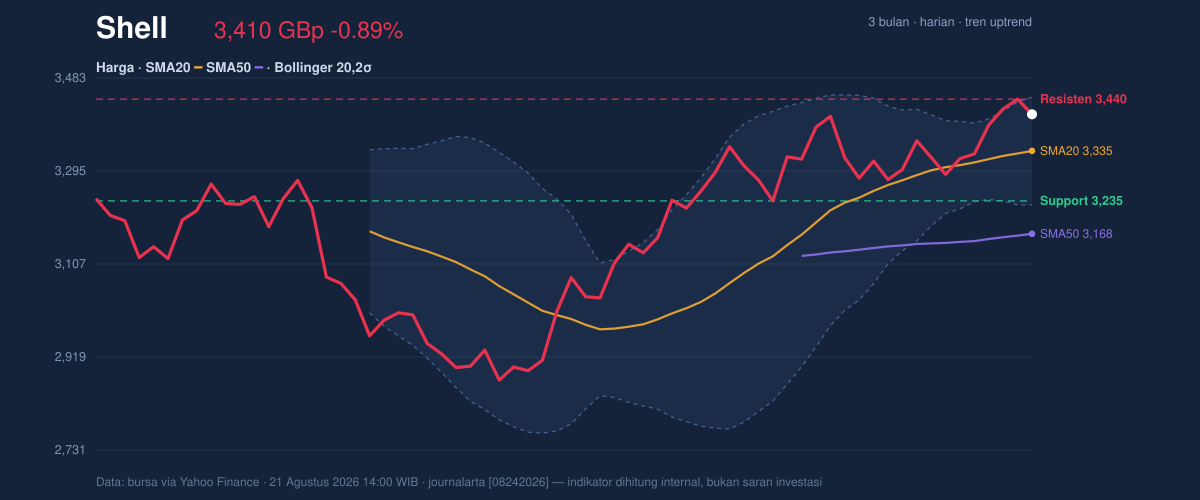
The Bollinger Bands reinforce that reading. With the upper band at 3,444.24, the middle band at the 3,335.48 SMA20, and the lower band at 3,226.71, Shell is sitting near the upper half of the envelope without yet punching through it. The %B at 84% means price is relatively close to the top band, which usually signals strength, but the key nuance is that the 6.5% band width is narrowing. A squeeze often means the market is coiling for a larger move, not that the move has already happened.
Oscillators & Momentum
Momentum is still supportive, but not euphoric. The RSI(14) at 61.2 is best read as neutral-to-firm rather than overbought, which suggests the stock has room to extend higher if buyers return. The Stochastic %K at 76.0 and %D at 87.9 sit in the upper part of the scale, showing the shares have been strong recently, though the gap between the two lines hints that the move may be pausing rather than accelerating.
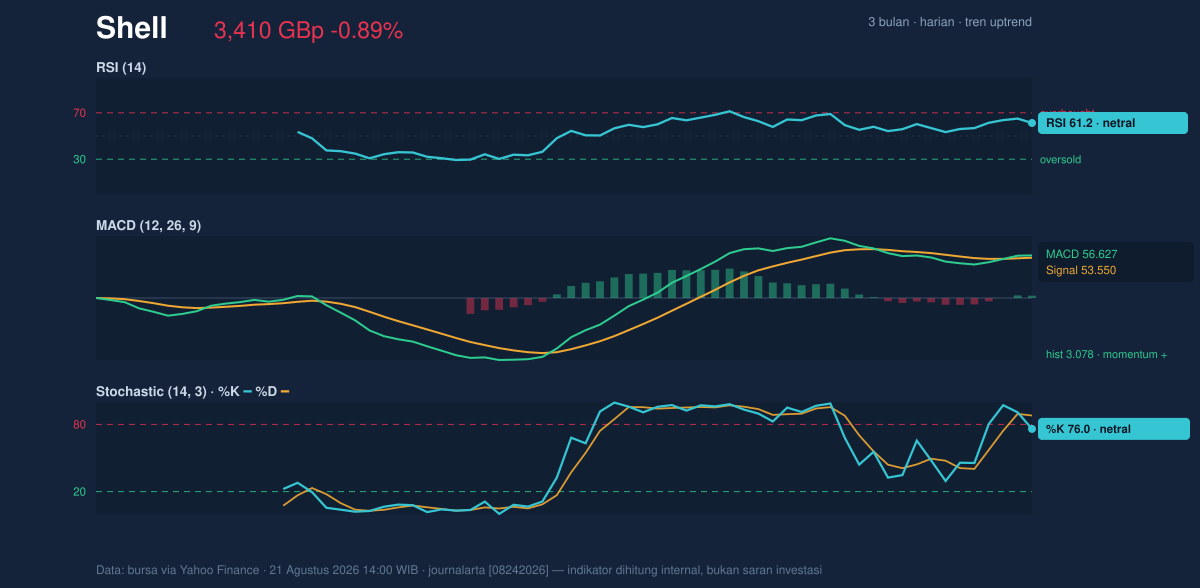
The more important signal is in MACD. The MACD at 56.627 is above the signal line at 53.550, with a positive histogram of 3.078. That combination means the trend’s internal momentum is still tilted upward; in practical terms, buyers have not lost control, even if the stock is not surging on the day. This is the sort of setup that often appears when a market is consolidating above support rather than rolling over.
Volume adds confirmation. Last volume of 12,439,271 was about 1.4× the 20-hour average of 8,775,161, and OBV is rising. OBV, or on-balance volume, is a cumulative gauge of whether volume is coming in on up days or down days. Rising OBV alongside an uptrend usually means the advance has participation behind it, not just thin trading.
Volatility & Volume
The ATR(14) at 59.77, equal to 1.8% of price, points to moderate volatility. That matters because it frames how far the stock can reasonably move in a session without breaking its character. Combined with the narrowing Bollinger Bands, the message is that Shell may be preparing for a wider move, but the direction still needs confirmation from price itself.
The recent day’s dip, therefore, looks more like a test than a reversal. If the shares can hold above the middle band and the SMA20, the current pause would fit a healthy trend. If they lose that area, the market would start to question whether the recent advance has simply run too far ahead of itself.
Key Levels & Scenarios
The chart’s most important levels are straightforward. 3,440.00 is the first resistance to watch, because it is both the recent ceiling and the prior close. A move through that area would place the stock into the upper Bollinger band region and would suggest the squeeze is resolving upward. On the downside, 3,335.48 is the first technical pivot, while 3,234.50 is the more meaningful support that separates a routine pullback from a deeper retracement.
If Shell holds above the SMA20 and reclaims 3,440.00, the chart would indicate renewed upside pressure. If it fails to hold 3,234.50, the current trend case weakens because that would pull price back toward the lower band and away from the recent breakout zone. For now, the evidence still favors consolidation within an uptrend rather than distribution.
Technical Verdict: HOLD (wait & see)
- Strongest reasons: price remains above the SMA20 and SMA50, the MACD is positive with a rising histogram, and volume is 1.4× normal with OBV rising.
- The caution: RSI at 61.2 is healthy but not deeply supportive of fresh acceleration, while Stochastic is elevated and the Bollinger Bands are squeezing, which often means the next move needs confirmation.
- Verdict invalidated if price breaks below 3,234.50, because that would undermine the current support structure and weaken the uptrend case.
- Ideal Entry Range: 3,335.48 to 3,440.00
- Exit Target: 3,444.24 and then a move beyond the upper band if momentum expands
- Stop Loss protection: below 3,234.50
For non-traders, that means Shell still looks technically healthy, but the next decisive move has not arrived yet.
“Right now the market is asking whether this is just a pause — or the start of the next leg,” one trader said.
Summary Data Shell
| Last price | 3,409.50 GBp |
| Change 1 day / 5 days / 1 month | -0.89% / 2.70% / 3.15% |
| Trend / MA-cross | uptrend / none |
| SMA20 / SMA50 | 3,335.48 / 3,168.15 |
| RSI (14) / Stochastic %K | 61.2 / 76.0 |
| Bollinger %B / ATR | 84% / 59.77 |
| Support / Resistance 20 days | 3,234.50 / 3,440.00 |
| Data as of | 21 Agustus 2026 14:00 WIB |
Track Shell share price daily: live levels, support/resistance and our full Shell analysis history.