Testing Key Resistance, TSLA Stock Gains 5.14% Today
On Agustus 24, 2026: price 362.86 USD, trend sideways, RSI 57.8, support 298.32, resistance 362.86. technical analysis of tsla stock. Testing Key Resistance —…
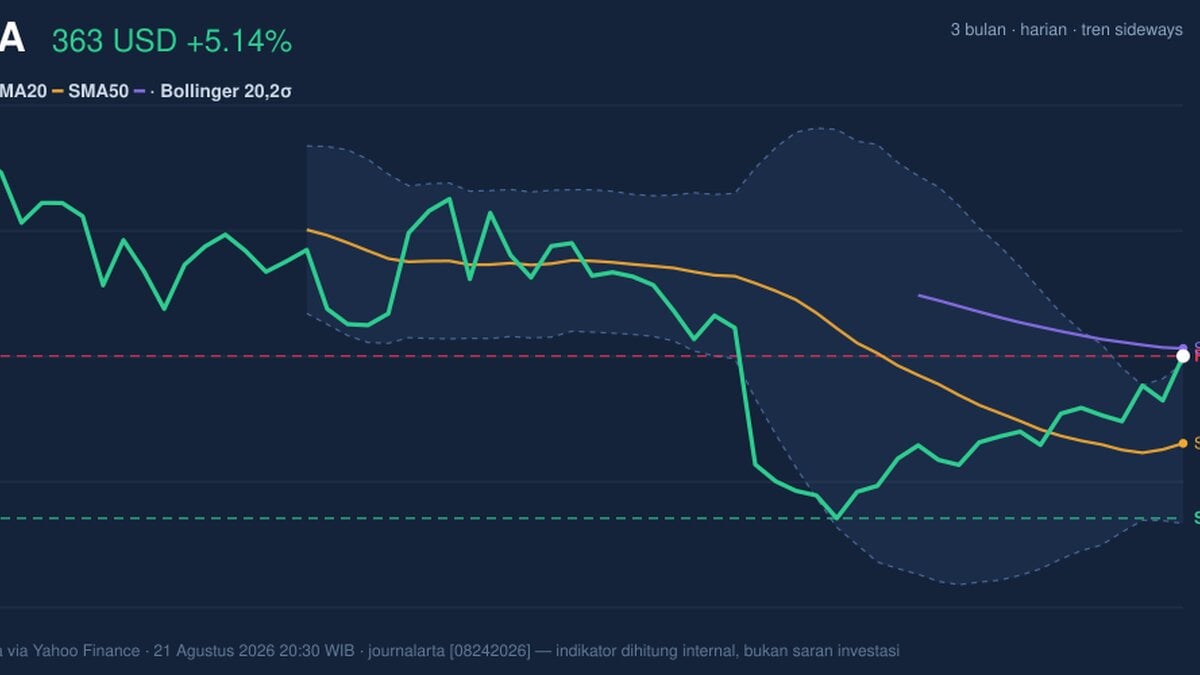
Tesla shares rose on NASDAQ in New York, with TSLA last at 362.86 USD after a 5.14% one-day gain, pushing the stock to the top of its recent trading range. The move matters because it came with a clear pickup in participation: volume surged to 58,979,800, or 1.7× the 20-day average, while the stock finished just above a key technical ceiling shown on the chart.
Trend & Price Action
The broader setup is still best described as sideways, not a clean uptrend, even though the shares have rallied 15.92% over the past month. The reason is in the moving averages: TSLA is above the SMA20 at 328.14, which shows near-term strength, but it is still below the SMA50 at 365.86. That gap tells readers the stock has improved quickly, yet it has not fully reclaimed the longer-term trend line that often separates a bounce from a more durable advance.
The slope of the SMA20, at -0.30% over 5 days, also signals that the short-term trend has not fully turned higher. In plain language, the stock is rising inside a broader range, but the underlying trend structure is still mixed. As shown in the chart, the price has now reached 362.86, which is also the top of the 20-hour range and sits just under the 20-day Bollinger upper band at 360.02 — a sign that the latest push has already stretched the near-term setup.
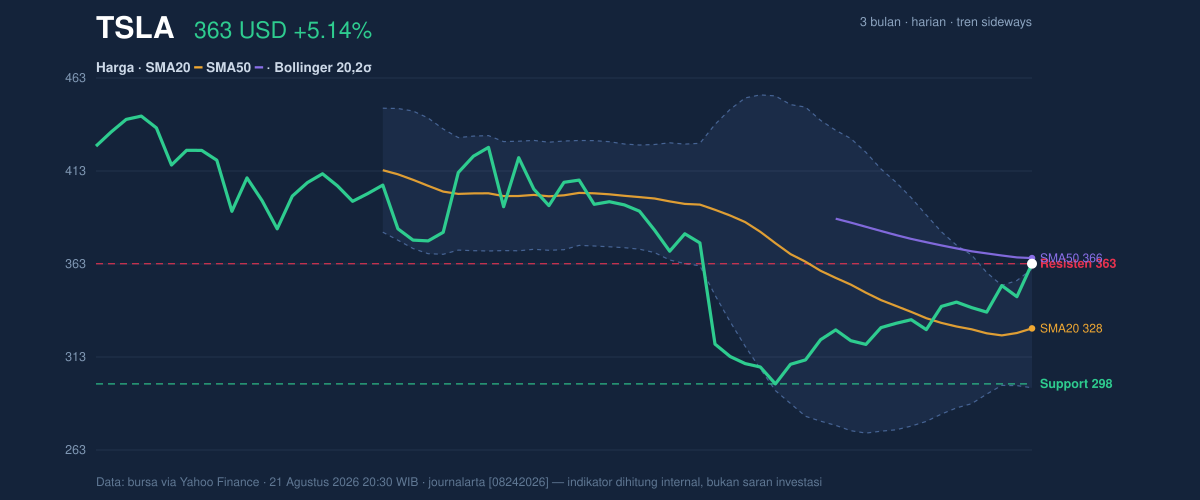
The chart also shows a key context point: the stock is trading near the upper end of its 3-month range between 297.38 and 445.60. That means the market has recovered from the lower part of the range, but it is still well below the 3-month peak, so the recent strength is meaningful without yet proving a full breakout.
Oscillators & Momentum
Momentum indicators are sending a split message. RSI at 57.8 is neutral, which means the stock is not yet in a classic overbought or oversold state on that measure. But Stochastic %K at 92.9 and %D at 92.0 are both in overbought territory, suggesting the recent climb has been fast enough that short-term traders may already be crowded into the move.
That overbought reading does not automatically mean reversal, but it does mean the stock may need either a pause or a fresh catalyst to keep climbing without friction. The more constructive signal comes from MACD: MACD at -3.485 is still below zero, yet it is above the signal line at -9.788, leaving a positive histogram of 6.303. In technical terms, that shows downside momentum is fading and the short-term trend is improving, even if the longer trend has not fully flipped.
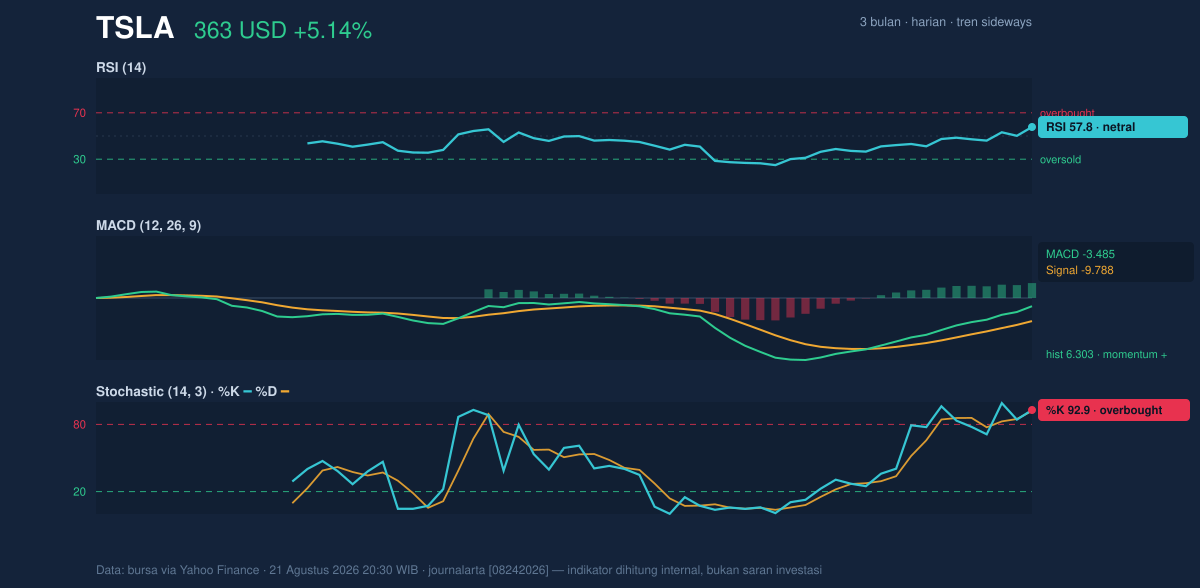
So the momentum picture is not uniform. RSI is neutral, Stochastic is stretched, and MACD is improving. That combination usually means a stock can keep moving higher, but often with more stop-start trading than a clean trend. The signal is less “launching” and more “recovering with caution.”
Volatility & Volume
Volatility is moderate rather than extreme. ATR(14) at 11.51, equal to 3.2% of price, suggests the stock can still swing meaningfully in a session, but not in a disorderly way. The Bollinger Bands reinforce that view: the band width is 19.4%, described as normal, which means the market is not in a squeeze that often precedes a sharp expansion, nor is it in an unusually wide, unstable phase.
The more important detail is where price sits relative to those bands. With %B at 104%, TSLA is trading slightly above the upper band. That often signals short-term strength, but it can also hint that the move is running ahead of itself. When price closes above the upper band, it usually means buyers are in control for now; when that happens alongside overbought Stochastic readings, the market is often vulnerable to consolidation rather than immediate continuation.
Volume and OBV lean more positive. The volume spike to 58,979,800 versus the 20-day average of 35,074,445 suggests the move was supported by real participation, not just thin trading. Rising OBV confirms that buyers have been accumulating shares as price advances. That matters because a breakout attempt without volume can fade quickly; here, the market at least showed commitment behind the move.
Key Levels & Scenarios
The most important level from the data is the current high and resistance area at 362.86. That is where the market closed, and it also marks the top of the 20-hour range. Above that, the next technical reference is the SMA50 at 365.86, which acts as a nearby hurdle. A move through that zone would be the first sign that the recent rebound is doing more than just testing the top of the range.
On the downside, the clearest support is the SMA20 at 328.14. If the stock fails to hold above that area, the recent rally would start to look more like a short-lived extension inside a sideways market. The deeper support in the data is 298.32, very close to the 3-month low of 297.38, which would matter if sentiment deteriorates and the stock gives back a large part of the recent gain.
Technical Verdict: HOLD (wait & see)
HOLD (wait & see)
- MACD is improving with a positive histogram, which supports the rebound.
- Volume is 1.7× the 20-day average and OBV is rising, confirming participation.
- Stochastic is overbought and price is above the upper Bollinger band, so the move looks extended in the short term.
- Verdict invalidated if price falls below 328.14, the SMA20 and nearest major support in the data.
- Ideal Entry Range: 328.14 to 345.13
- Exit Target: 365.86
- Stop Loss protection: 298.32
In plain English: the stock looks healthier than it did a month ago, but it is also stretched enough that confirmation is still needed before the next leg can be trusted.
Tesla’s next closely watched development is whether the shares can hold above 362.86 and then challenge the SMA50 at 365.86 in the next session.
Summary Data TSLA
| Last price | 362.86 USD |
| Change 1 day / 5 days / 1 month | 5.14% / 6.02% / 15.92% |
| Trend / MA-cross | sideways / none |
| SMA20 / SMA50 | 328.14 / 365.86 |
| RSI (14) / Stochastic %K | 57.8 / 92.9 |
| Bollinger %B / ATR | 104% / 11.51 |
| Support / Resistance 20 days | 298.32 / 362.86 |
| Data as of | 21 Agustus 2026 20:30 WIB |
Track TSLA stock price daily: live levels, support/resistance and our full TSLA analysis history.