Visa Stock Gains 1.45%, Testing Key Resistance In Focus
On Agustus 24, 2026: price 371.04 USD, trend uptrend, RSI 61.1, support 358.84, resistance 371.04. technical analysis of visa stock. Visa Stock Gains — full…
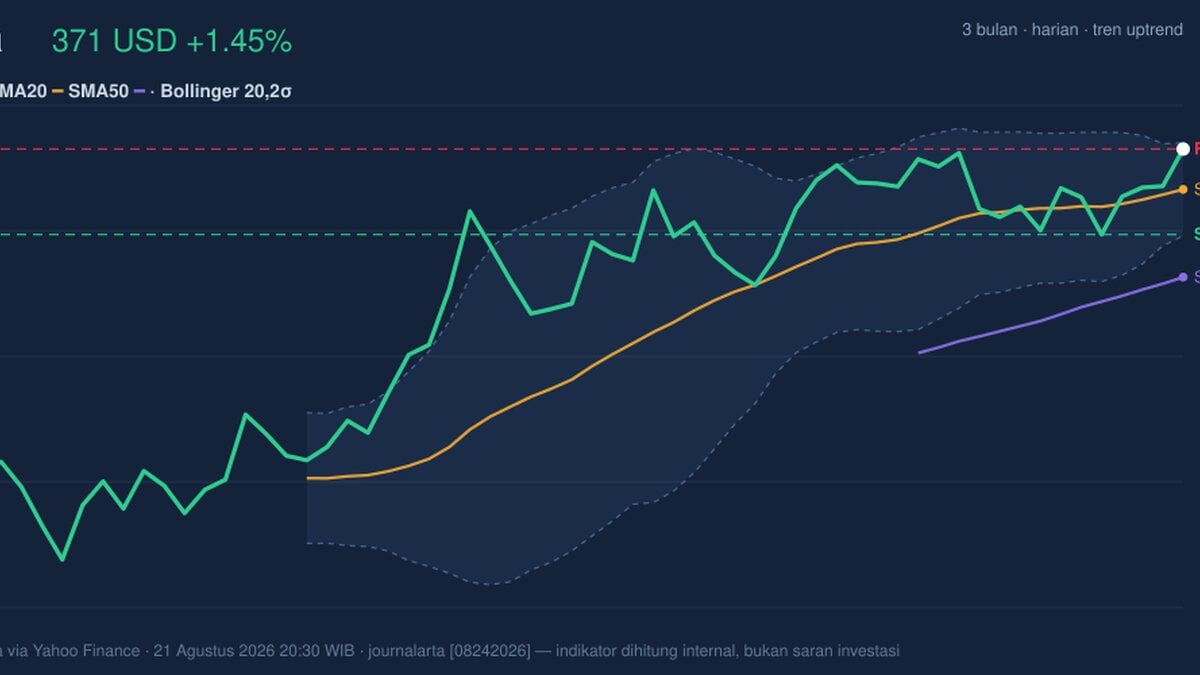
Visa rose to 371.04 USD on the NYSE, up 1.45% from the previous close of 365.73, and the move leaves the stock pressing against the top of its short-term trading band, as shown in the chart. That matters because this is not just a one-day pop: the shares are now trading above the 20-day average, the 20-day trend is still pointing higher, and the price is sitting within striking distance of the 3-month high of 373.97. In plain terms, buyers are still in control, but they are now asking the market to prove it can keep going rather than simply bounce.
Trend & Price Action
The broader message from the chart is constructive. Visa is above its SMA20 at 365.28 and also comfortably above its SMA50 at 352.75, which tells investors the stock is trading above both its short- and medium-term trend lines. That is usually a sign that recent strength has not been isolated to one session. The SMA20 slope of 0.66% over 5 days adds to that reading, because a rising moving average suggests the trend itself is still improving rather than merely holding steady.
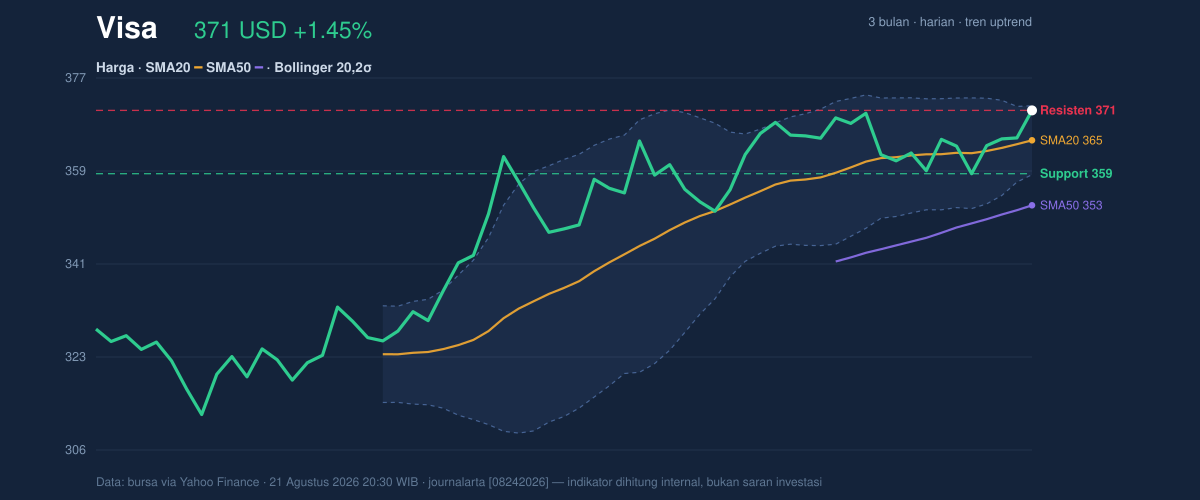
The more nuanced signal is that the price is now at the very edge of its range. The 20-hour resistance at 371.04 has effectively been reached, while the 20-hour support at 358.84 sits well below. When a stock trades at the top of its recent range, it often means the next move depends less on trend direction and more on whether fresh demand appears to absorb overhead supply. Visa is also only a few dollars below its 3-month high of 373.97, so the market is close to a test of whether this advance has enough energy to extend.
The Bollinger Bands reinforce that tension. The upper band at 371.92 is just above the current price, while the middle band is identical to the SMA20 at 365.28. That positioning shows the stock is stretched toward the upper boundary of its normal trading envelope. With the Bollinger width at 3.6%, the bands are relatively tight, which often means volatility has compressed and a larger move may be building. A squeeze does not predict direction, but it does tell you the market is storing energy.
Oscillators & Momentum
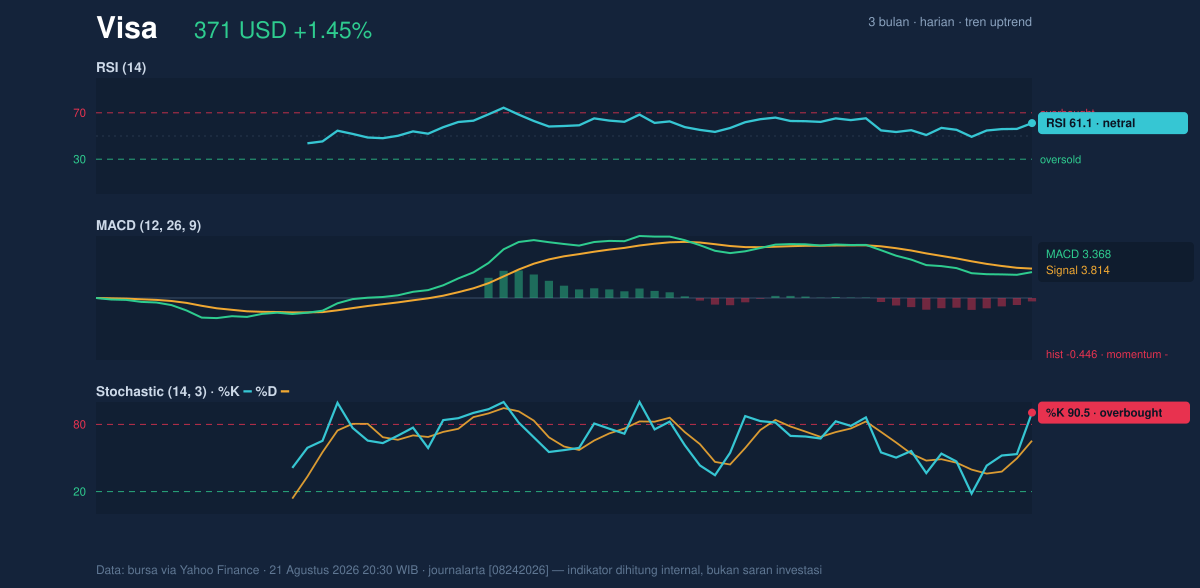
Momentum is where the picture becomes more mixed. RSI at 61.1 is still broadly neutral, which means Visa is not yet in the kind of overheated territory that usually signals an immediate reversal. But the Stochastic %K at 90.5 versus %D at 65.4 is an overbought reading, and that tells a different story: the stock has moved up quickly enough that short-term traders may already be crowded on the same side.
The MACD at 3.368 sits below its signal line at 3.814, with a histogram of -0.446. That is the clearest warning in the data. MACD measures whether upward momentum is accelerating or fading, and a negative histogram means the short-term pace has weakened even while price has held near highs. In other words, the trend is still up, but the engine is not revving as hard as the price action alone might suggest.
That combination — neutral RSI, overbought Stochastic, negative MACD histogram — usually implies a market that is extended but not necessarily broken. It can keep rising if volume and demand improve, yet the odds of choppy trading rise when momentum indicators stop agreeing with the price.
Volatility & Volume
Volume adds another layer of caution. Last trade volume was 6,667,100, below the 20-session average of 7,375,355, or about 0.9x normal. That means the latest push higher did not come with especially strong participation. When a stock is testing a resistance area on lighter-than-average volume, the move can still work, but it often needs confirmation from a stronger session to convince the market that the breakout is genuine rather than a brief overshoot.
At the same time, OBV is rising, which is important because on-balance volume tracks whether money has been steadily flowing into the stock over time. Rising OBV alongside a higher price suggests the underlying bid has not disappeared. The message is not that buyers are absent; it is that they have not yet shown the kind of broad participation that typically accompanies a decisive breakout.
ATR is also worth noting. ATR(14) at 6.41, or 1.7% of price, points to moderate day-to-day movement. That means Visa is not in a highly erratic phase, but the compressed Bollinger width suggests the next expansion could still be meaningful if the stock escapes the current band.
Key Levels & Scenarios
The immediate map is straightforward. 371.04 is the current pivot, with 371.92 as the next visible ceiling from Bollinger resistance and 373.97 as the nearby 3-month high. On the downside, 365.28 is the first technical support because it marks the SMA20 and Bollinger middle band, while 358.84 is the more important floor from the 20-hour range.
If Visa can clear the upper band and then the 3-month high, the chart would shift from a stretched uptrend to a stronger breakout structure. If it fails to hold above the 20-day average, the current advance would look more like an exhaustion move inside a still-intact trend.
Technical Verdict: HOLD (wait & see)
HOLD (wait & see)
- Reason 1: Trend is positive — price is above SMA20 at 365.28 and SMA50 at 352.75, with the SMA20 slope still rising.
- Reason 2: Momentum is not fully aligned — Stochastic is overbought at 90.5 and MACD histogram is negative at -0.446, which argues for caution near resistance.
- Reason 3: Participation is only moderate — volume is 0.9x normal, so the test of resistance lacks strong confirmation even though OBV is rising.
- Verdict invalidated if price breaks below 358.84, because that would damage the short-term range structure and weaken the current trend case.
- Ideal entry range: 365.28 to 358.84
- Exit target: 371.92 to 373.97
- Stop loss protection: below 358.84
For non-traders, this means Visa is still acting well, but it is now close enough to resistance that the market needs to show its next move before the picture becomes clearer.
Summary Data Visa
| Last price | 371.04 USD |
| Change 1 day / 5 days / 1 month | 1.45% / 1.89% / 4.30% |
| Trend / MA-cross | uptrend / none |
| SMA20 / SMA50 | 365.28 / 352.75 |
| RSI (14) / Stochastic %K | 61.1 / 90.5 |
| Bollinger %B / ATR | 93% / 6.41 |
| Support / Resistance 20 days | 358.84 / 371.04 |
| Data as of | 21 Agustus 2026 20:30 WIB |
Track Visa stock price daily: live levels, support/resistance and our full Visa analysis history.