ADBE Testing Key Resistance: Stock Gains 5.73% (Agustus 28, 2026)
On Agustus 28, 2026: price 289.15 USD, trend uptrend, RSI 67.7, support 250.41, resistance 289.15. technical analysis of adbe stock. ADBE Testing Key…
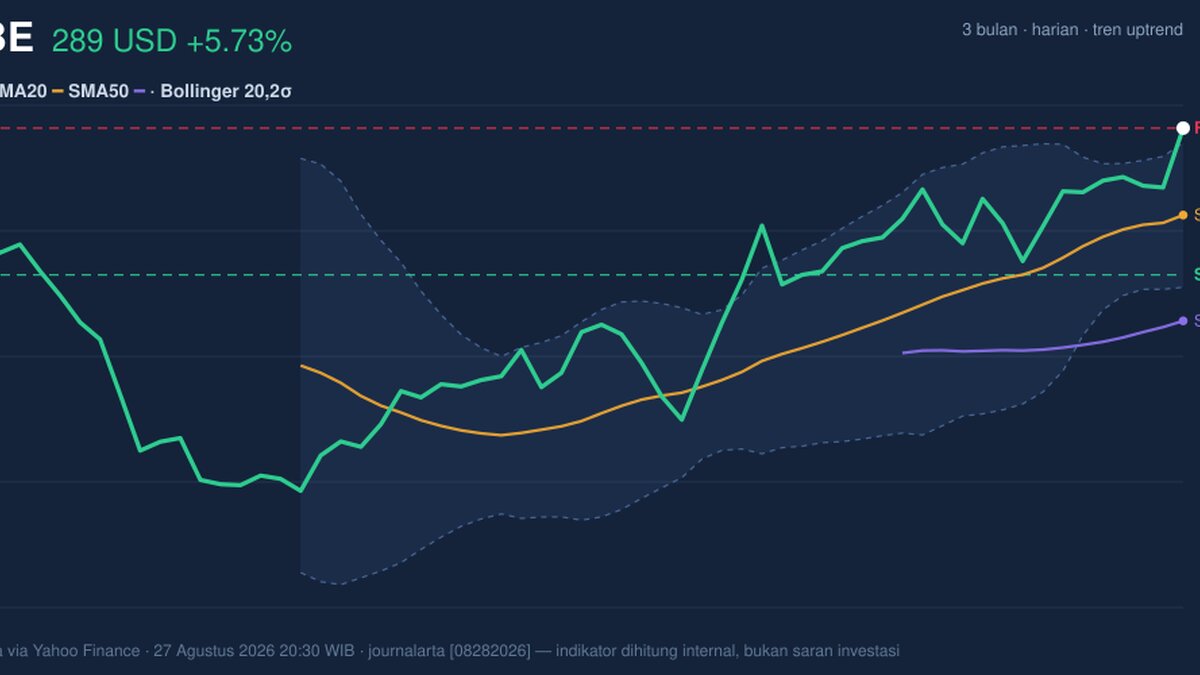
Adobe Inc. advanced on the NASDAQ to 289.15 USD on 27 August 2026, extending a move that lifted the stock 5.73% in one day and 16.64% over one month, with the latest price now sitting at the top of its recent trading range. The message from the tape is straightforward: buyers have been willing to pay up, but the chart is also showing signs that the move is getting stretched. That combination matters because strong trends can keep running, yet near-term momentum often cools when a stock reaches the upper edge of its volatility band.
Trend & Price Action
The broader structure remains constructive. Adobe is trading above its SMA20 at 266.20 and well above its SMA50 at 238.27, which tells us the stock is not just bouncing but remains in an established uptrend. The SMA20 slope of 3.19% over 5 days reinforces that the short-term trend is still rising rather than flattening out. In plain terms, the average price over the last month is moving higher, and the shorter average is rising faster, a sign that momentum has been strong enough to pull the trend upward. There is no new MA-cross, so the market is not currently being driven by a fresh moving-average crossover event; instead, it is extending a trend already in place. As shown in the chart, the price is now pressing against the upper end of the recent range, with the 20-hour resistance at 289.15 matching the latest print and the 3-month high at 291.18 sitting just above it.
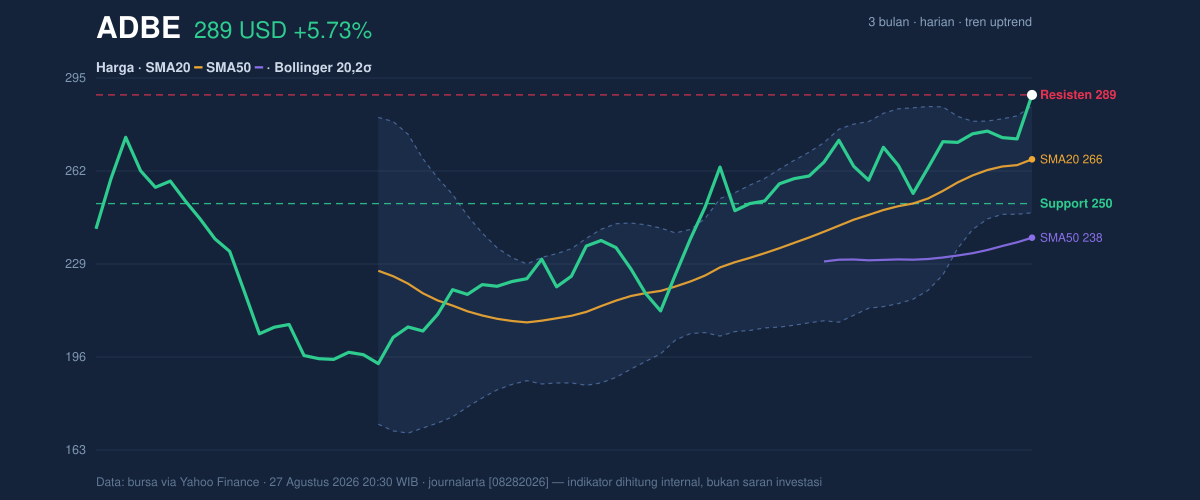
That is the kind of setup that often attracts attention from trend-followers and prompts caution from short-term traders.
Oscillators & Momentum
Momentum indicators are telling a more nuanced story. The RSI at 67.7 is still described as neutral in the data, but it is close enough to the typical overbought zone to suggest the rally is no longer early-stage. More importantly, the Stochastic %K at 94.9 and %D at 85.7 are both in overbought territory, which means the stock has been closing near the top of its recent daily ranges for long enough to look extended. That does not automatically signal reversal; in strong trends, stochastic oscillators can stay elevated. But it does mean the stock is vulnerable to pauses, especially if buyers stop chasing strength.
The MACD at 10.666 above the signal line at 10.006, with a 0.660 histogram, shows the trend is still being confirmed by positive momentum. In practical terms, MACD is saying the rally still has internal support, even if it is becoming less efficient. As shown in the chart, the oscillators are not flashing a broad reversal, but they are warning that upside may need fresh volume to keep extending cleanly.
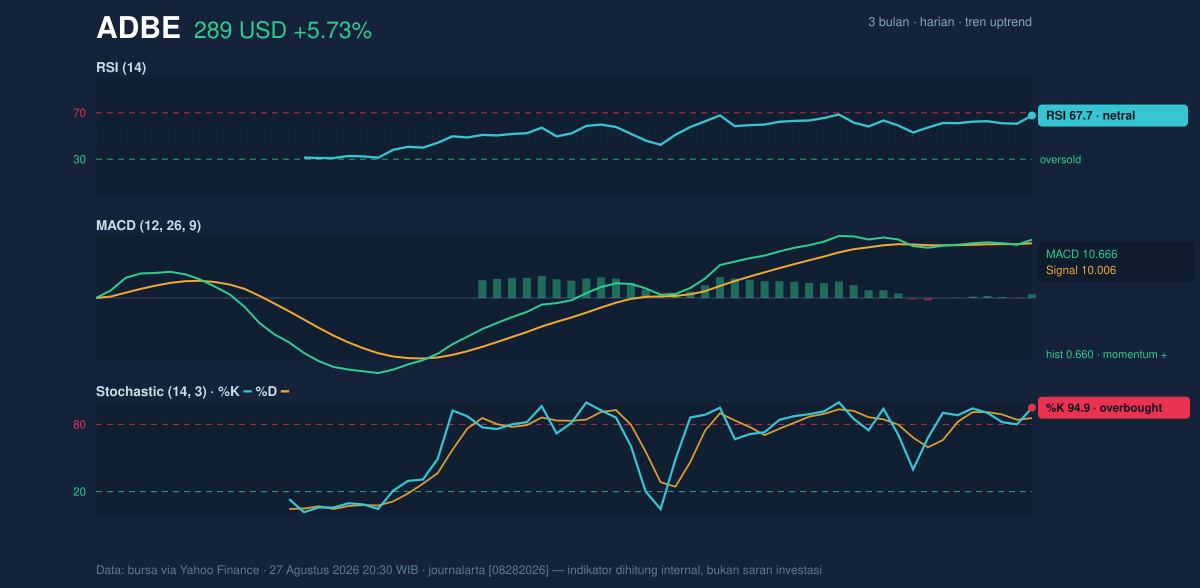
So the signal is mixed: trend remains positive, but the shorter-term momentum is hot.
Volatility & Volume
Volatility is elevated, but not in a panic mode. The ATR(14) at 10.69, equal to 3.7% of price, indicates the stock is capable of sizable daily swings. That matters because when a name is trading near resistance and the average daily range is this wide, the next move can be abrupt in either direction. The Bollinger Band upper level at 285.26 has already been exceeded, with %B at 110%, which means Adobe is trading above the top band. In technical terms, that is an extension signal: price has moved beyond the range that normally contains most closes, often a sign of strength, but also a sign that the move may be ahead of itself in the short run. The Bollinger band width of 14.3% is described as normal, so this is not a squeeze setup where volatility is about to explode from a tight coil; rather, it is a trend that is already in motion.
Volume confirms participation. The latest 6,521,600 shares traded versus a 20-hour average of 4,343,330, or 1.5× normal activity, while OBV is rising. That combination matters because rising price on stronger volume usually means the move is being supported by real participation, not just thin trading. Put simply, buyers are showing up.
Key Levels & Scenarios
The immediate reference point is the 20-hour resistance at 289.15, which the stock has already reached. Above that, the next visible ceiling is the 3-month high at 291.18. On the downside, the most relevant nearby support is the 20-hour support at 250.41, followed by the SMA20 at 266.20, which now acts as a trend line the market would need to defend to keep the current structure intact. Because price is sitting at 100% of the recent range, the market is effectively testing the boundary rather than trading comfortably inside it.
If Adobe holds above the recent breakout area, the chart suggests continuation is still possible, but the overbought stochastic reading means the move may be choppy rather than smooth. If it slips back below the upper band and loses the short-term range edge, the first test would be whether the SMA20 at 266.20 can absorb the selling. A break below that level would weaken the current trend structure more meaningfully.
Technical Verdict: HOLD (wait & see)
HOLD (wait & see)
- MACD remains positive, showing the trend still has supportive momentum.
- Price is extended above the Bollinger upper band with %B at 110%, which raises the risk of near-term cooling.
- Stochastic is overbought, while volume is 1.5× average and OBV is rising, so participation is strong but stretched.
Verdict invalidated if price falls below 266.20, where the SMA20 sits and the short-term trend would start to lose its footing.
- Ideal Entry Range: 266.20 to 285.26
- Exit Target: 291.18
- Stop Loss protection: 250.41
For non-traders: Adobe’s chart is still strong, but it is already trading at a level where the next move could pause or pull back before it tries to go higher.
Summary Data ADBE
| Last price | 289.15 USD |
| Change 1 day / 5 days / 1 month | 5.73% / 6.22% / 16.64% |
| Trend / MA-cross | uptrend / none |
| SMA20 / SMA50 | 266.20 / 238.27 |
| RSI (14) / Stochastic %K | 67.7 / 94.9 |
| Bollinger %B / ATR | 110% / 10.69 |
| Support / Resistance 20 days | 250.41 / 289.15 |
| Data as of | 27 Agustus 2026 20:30 WIB |
Track ADBE stock price daily: live levels, support/resistance and our full ADBE analysis history.